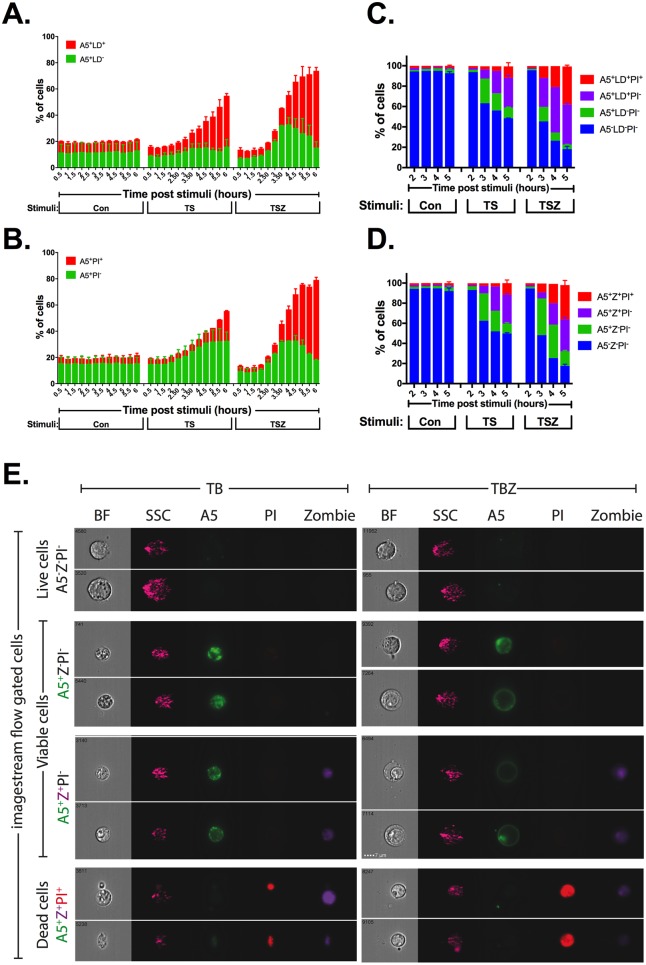
Fig 2. Necroptotic cells expose PS to the outer plasma membrane prior to its permeabilization.
U937 cells were stimulated for either (i) apoptosis (TS), necroptosis (TSZ), or (ii) left untreated (Con). (A–D) Cell viability was measured at different time points after stimulation of cell death by flow cytometry using (A) A5 and LD, (B) A5- and PI-staining, (C) A5, LD, and PI or (D) A5, Z, and PI triple staining. (E) Four hours after stimulation of apoptosis (TB) or necroptosis (TBZ), U937 cells were triple stained with A5, Z, and PI, and analyzed by imagestream flow cytometry. Example imagestream flow plots are shown, brightness contrast for each channel between each population was identical. Representative data are shown from 1 of at least 2 independent experiments that were carried out. All raw data for the data summarized under this Fig can be found in S2 Data. A5, annexin V; BF, bright field; Con, control; LD, LiveDead; PI, propidium iodide; PS, phosphatidylserine; SSC, side scatter; TB, TNFα + birinapant; TBZ, TNFα + birinapant + zVAD; TS, TNFα + SMAC mimetic; TSZ, TNFα + SMAC mimetic + zVAD; Z, Zombie.

