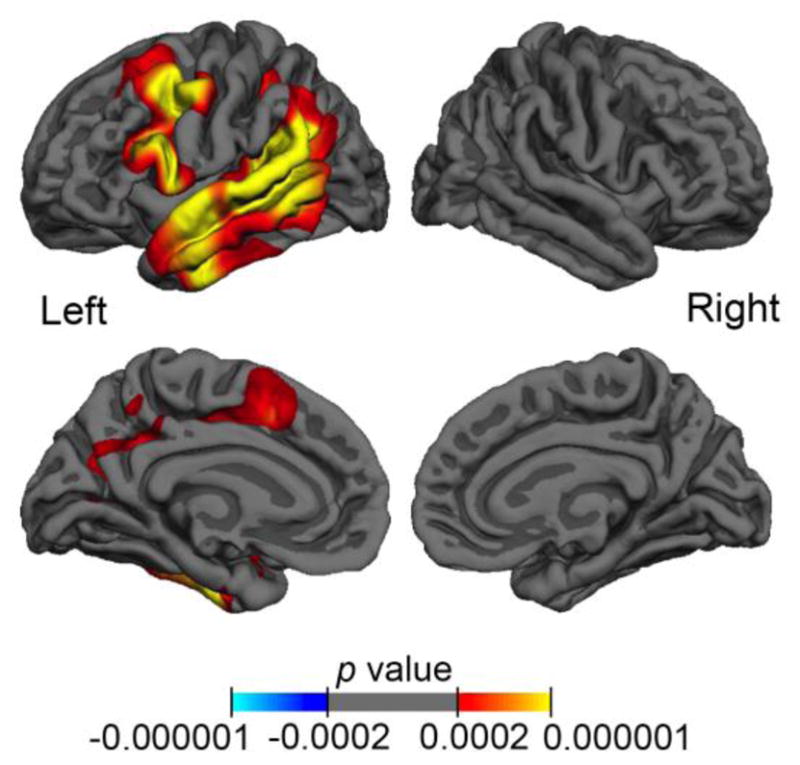
Figure 2. Peak PPA group atrophy patterns.

Significant peak atrophy patterns, as measured by cortical thickness, for PPA participants (n=21) compared to controls (n=35) are represented on the lateral and medial views of the left and right hemisphere. False discovery rate was stringently set to 0.001 to highlight peak atrophy; warmer colors represent significant thinning and corresponding p-values are displayed by the color bar.
