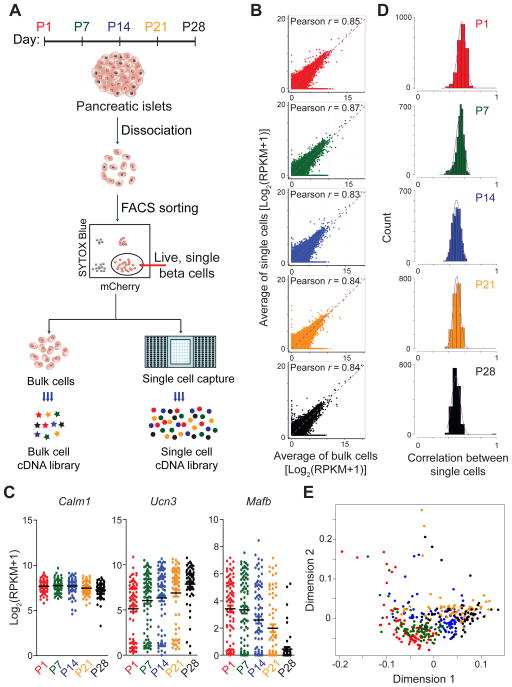
Figure 1. Single-cell RNA-sequencing of beta-cells during postnatal development.
A. Experimental overview. B. Correlation between average transcript levels of all genes detected in single cells and bulk cells. For single cells, gene expression was averaged across individual cells collected at different time points. Points are colored by postnatal (P) day collected (P1, red; P7, green; P14, blue; P21, orange; and P28, black). The same color-coding for groups was used across all figures. Pearson correlation coefficients r are given. C. Expression analysis of select genes showing variability in gene expression among single cells of the same age. Each point represents the gene expression level of an individual cell. Black bars represent the average of pooled single cells. D. Pairwise correlation of single-cell gene expression showing biological variation among single cells of the same age. The distribution of the pairwise Pearson’s correlation coefficients between single cells is plotted. E. Multidimensional scaling of single cell transcriptomes. The distance between any two cells reflects the similarity of their expression profiles. See also Figure S1 and Table S1.

