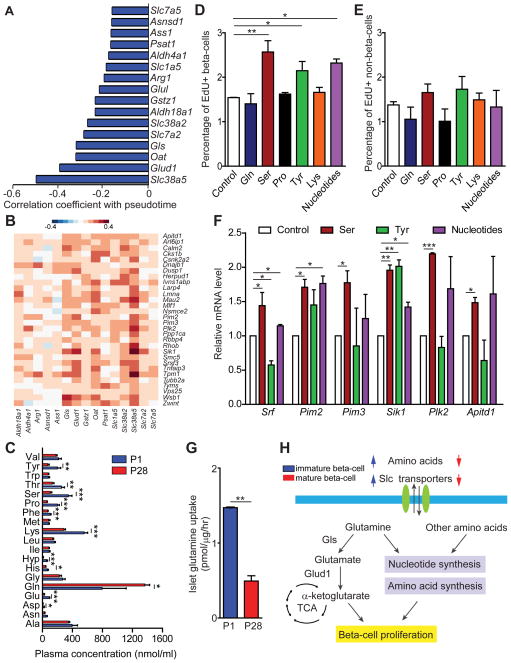
Figure 4. Amino acid supplementation increases beta-cell proliferation.
A. Amino acid transporter and metabolism genes downregulated with pseudotime with Pearson correlation coefficients. B. Heatmap showing Pearson correlation of gene expression in all 387 beta-cells comparing proliferation genes with genes encoding amino acid transporters and metabolizing enzymes downregulated with pseudotime. Proliferation genes are depicted in rows and amino acid transporters and metabolizing enzymes in columns. C. Plasma concentration of individual amino acids in mice at P1 (blue) and P28 (red). Data shown as mean ± SEM (n= 4 mice per group). D, E. Percentage of EdU+ beta-cells (D) and non-beta-cells (E) in islets from mice at P28 supplemented with nucleotides or amino acids. F. Quantitative RT-PCR analysis of proliferation genes after supplementation with serine, tyrosine or nucleotides. mRNA levels in control islets were set as 1. G. Glutamine uptake in mice at P1 (blue) and P28 (red). H. Schematic summarizing the observed gene expression changes during beta-cell maturation and effects on proliferation. In E-G, data are shown as mean ± SEM of three independent experiments. TCA, tricarboxylic acid cycle; Gls, glutaminase; Slc, solute carrier. * P < 0.05, ** P < 0.01, *** P < 0.001.

