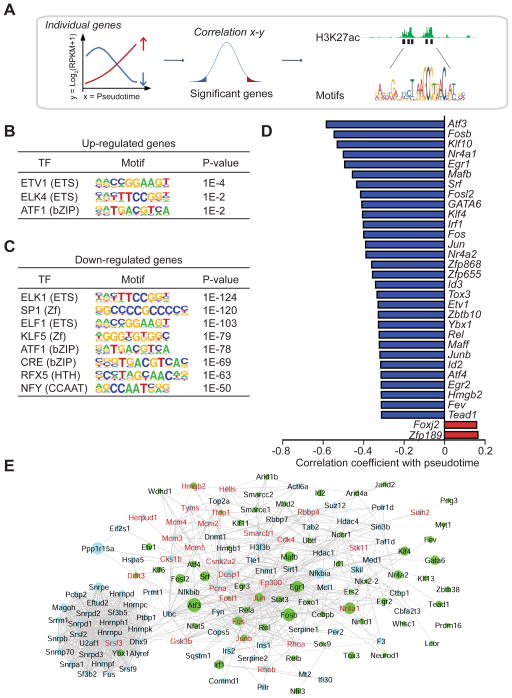
Figure 6. Transcription factors and target genes regulated during postnatal beta-cell development.
A. Workflow to identify TFs driving gene expression changes during pseudotime. Cis-regulatory analysis was performed on the most significant genes positively and negatively correlating with pseudotime (P <0.01) followed by annotation of TF binding motifs at their enhancers. B, C. Top TF binding motifs for up-regulated genes (B) and down-regulated genes (C) during pseudotime. Enrichment P values are shown. D. The top 2 up-regulated (red) and top 30 down-regulated (blue) TFs regulated with pseudotime with their Pearson correlation coefficient. E. Network of interactomic connections of TFs regulated during pseudotime with other pseudotemporally regulated genes. Green nodes represent TFs while light blue nodes represent pseudotemporally regulated genes. The size of the nodes is adjusted proportionally to the correlation coefficient of the gene expression level with pseudotime coordinates. Genes in red are associated with cell proliferation. See also Figure S6 and Table S5; S6.

