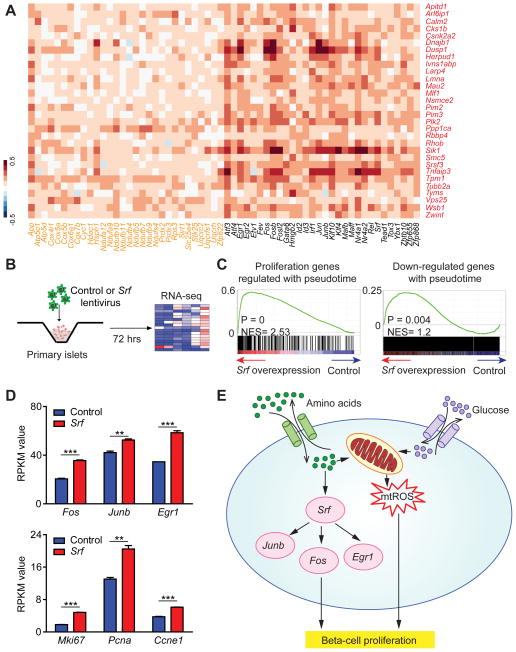
Figure 7. Srf regulates proliferation genes in beta-cells.
A. Heatmap showing Pearson correlation of gene expression profiles in all 387 beta-cells comparing proliferation genes with top pseudotemporally-regulated oxidative phosphorylation genes and TFs. Proliferation genes are depicted in red, oxidative phosphorylation genes in orange and TFs in black. B. Overview of RNA-seq analysis of lentiviral Srf overexpression in islets at P28. C. GSEA plots showing enrichment of proliferation genes regulated during pseudotime (left) and genes down-regulated during pseudotime (right) as an effect of Srf overexpression. RNA-seq data are from three independent transduction experiments. D. RPKM values of TFs Fos, Junb and Egr1 (top panel) and proliferation genes Mki67, Pcna and Ccne1 (bottom panel) in RNA-seq data from control and Srf-overexpressing islets. Data shown as mean ± SEM. E. Summary of metabolic regulators and effector TFs driving early neonatal beta-cell proliferation as revealed by reconstructing a pseudotemporal time course of beta-cell maturation, experimental validation, and prior literature. ** P < 0.01, *** P < 0.001. See also Figure S7 and Table S7.

