
Figure 5.
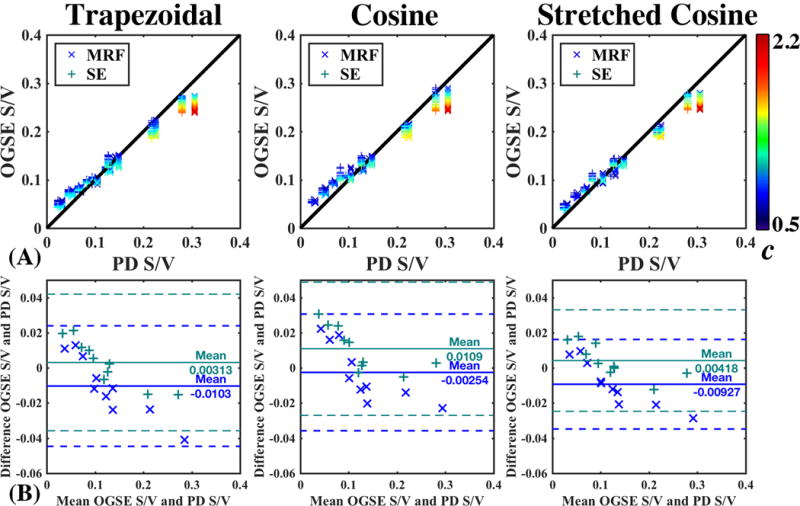
(A) Correlation plots comparing OGSE-derived S/V, Eq (1), to S/V derived from PD measurements, Eq (2), using either MRF (x) or SE (+). OGSE derived S/V as a function of c, a multiplicative factor that defines the number of points used per fit, cf. the text around Eq. (8). (B) Bland-Altman plot showing no systematic difference in S/V estimation.