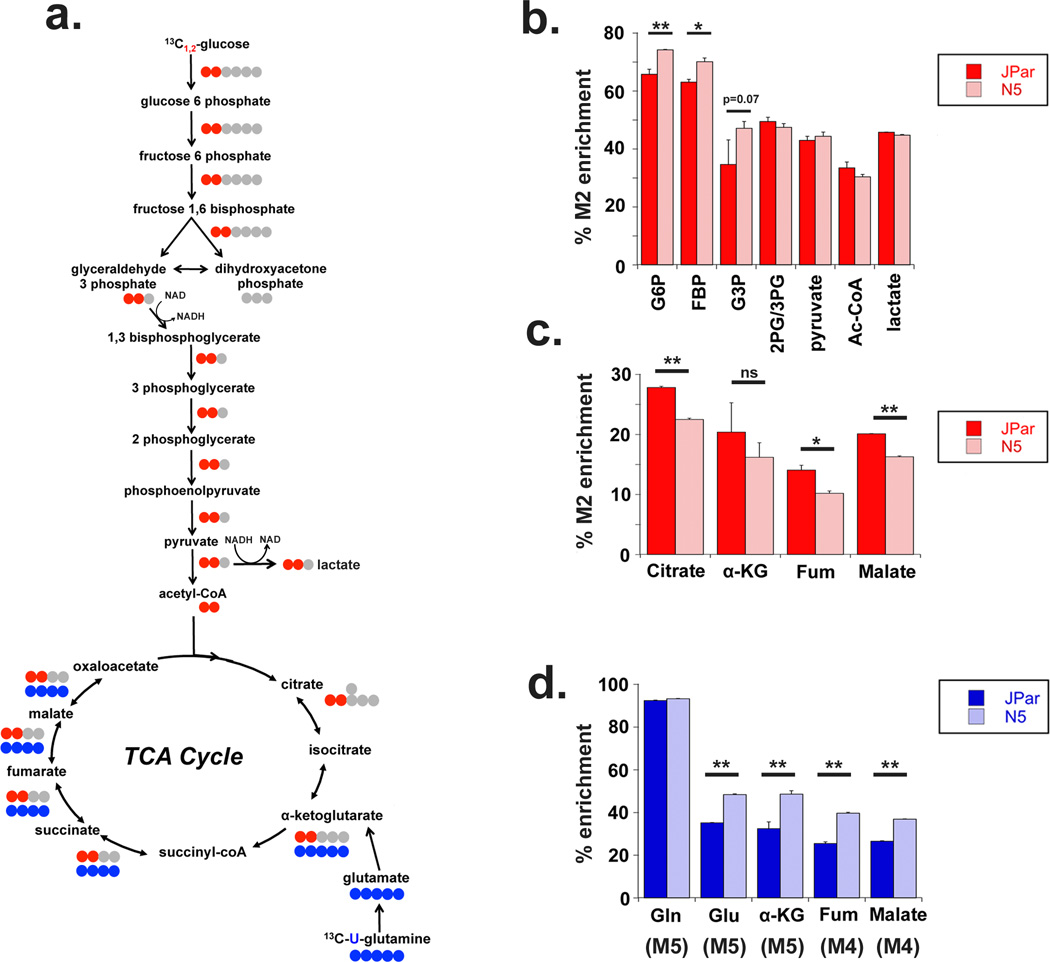
Figure 5. Noxa over-expressing cells increase glycolysis but not lactate production from glucose.
(a) Schematic tracing the incorporation of [13C] label from [1,2-13C] glucose (red) through glycolysis and the TCA cycle, and [U-13C] glutamine (blue) into TCA cycle metabolites. (b) Glycolysis metabolites labeled from [1,2-13C] glucose following 24 hours of labeling, shown as a percentage of total metabolite measured using LC/MS. G6P: glucose 6 phosphate, FBP: fructose 1,6 bisphosphatase, G3P: glyceraldehyde 3 phosphate, 2PG/3PG: phosphoglycerate. (c) TCA metabolites labeled from glucose carbon measured via LC/MS following 24 hours of labeling. (d) Enrichment of glutaminolytic and TCA metabolites derived from [U-13C] glutamine following 24 hours of labeling, detected using LC/MS. Gln: glutamine, Glu: glutamate, aKG: alpha-ketoglutarate, Fum: fumarate. Number of labeled carbons is indicated in parentheses. Data represented are the average and standard deviation of triplicate samples from a representative experiment repeated at least twice. Significance was calculated using the student’s T test (* p<0.01, ** p<0.001).

