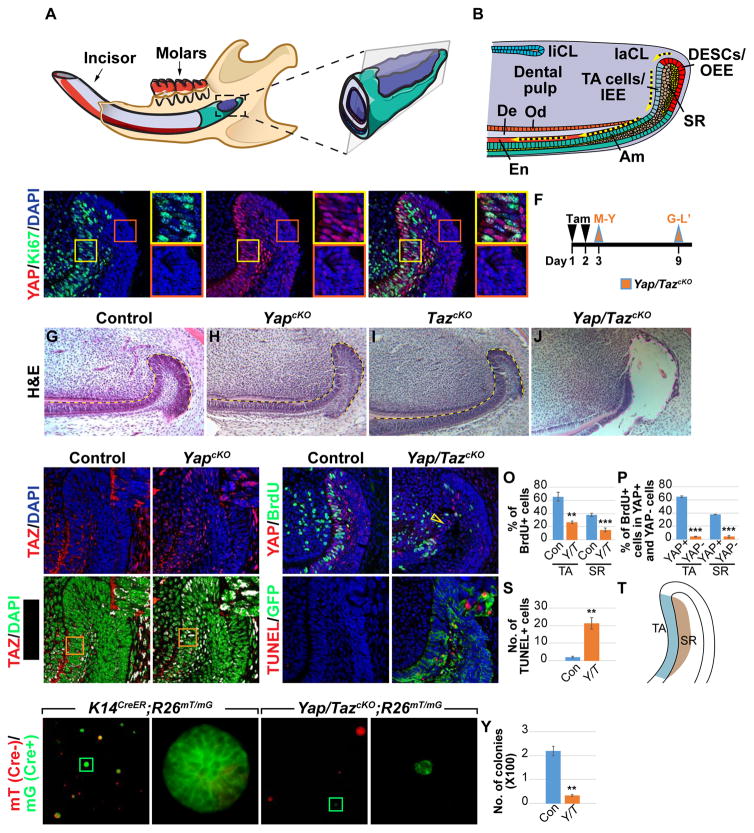
Figure 1. YAP/TAZ are required for the maintenance of laCLs.
(A) Schematic diagram of the mouse lower jaw.
(B) Cross section of the proximal incisor showing that in the labial cervical loop (laCL) dental epithelial stem cells (DESCs) in the outer enamel epithelium (OEE) give rise first to transitamplifying (TA) cells in the inner enamel epithelium (IEE) and then differentiated enamel (En)- secreting ameloblasts (Am). There are two morphologically distinct cell types in the stellate reticulum (SR) and inner SR cells underneath the TA cells also act as TA cells. De, dentin; liCL, lingual cervical loop; and Od, odontoblasts.
(C–E) Immunostaining of YAP and Ki67 in the laCL. Enlarged images of TA (yellow boxes) and OEE (red boxes) regions are also displayed.
(F) Timeline depicting Cre induction (tamoxifen (Tam) injection, black arrowheads) and sample collection (orange arrowheads).
(G–J) H&E staining of control (G), YapcKO (H), TazcKO (I), and Yap/TazcKO (J) laCLs. Pink dashed line outlines the tissue loss in (J).
(K–L’) TAZ immunostaining in control and YapcKO laCLs. Overlapping TAZ and DAPI staining is shown in white (K’ and L’). Insets are enlargements of the TA region.
(M–P) BrdU labeling in control and Yap/TazcKO laCLs. Open yellow arrowhead in (N) marks reduced proliferation. Quantification was performed by calculating the percentage of BrdUpositive (+) cells per section in control and Yap/TazcKO laCLs (O) and by comparing the percentage of BrdU+ cells between YAP+ and YAP- cells in mutant laCLs (P).
(Q–S) TUNEL staining shows increased cell death in Yap/TazcKO. GFP marks Cre active cells.
(T) Schematic diagram of the TA and SR regions used for quantification.
(U–Y) Colony formation assays in 3D matrigel. (V and X) are enlarged images of Cre active cells in (U and W). The average number of colonies (excluding single cells) per well is quantified (Y).
Dashed lines outline laCLs. Representative images and quantitative data are shown. Scale bar in (X) represents 50 μm in (C–E, K–N, Q, and R), 90 μm in (G–J), 240 μm in (U and W), 15 μm in
(V and X). All quantitative data are presented as mean ± SD. **p<0.01; ***p<0.001.
See also Figure S1

