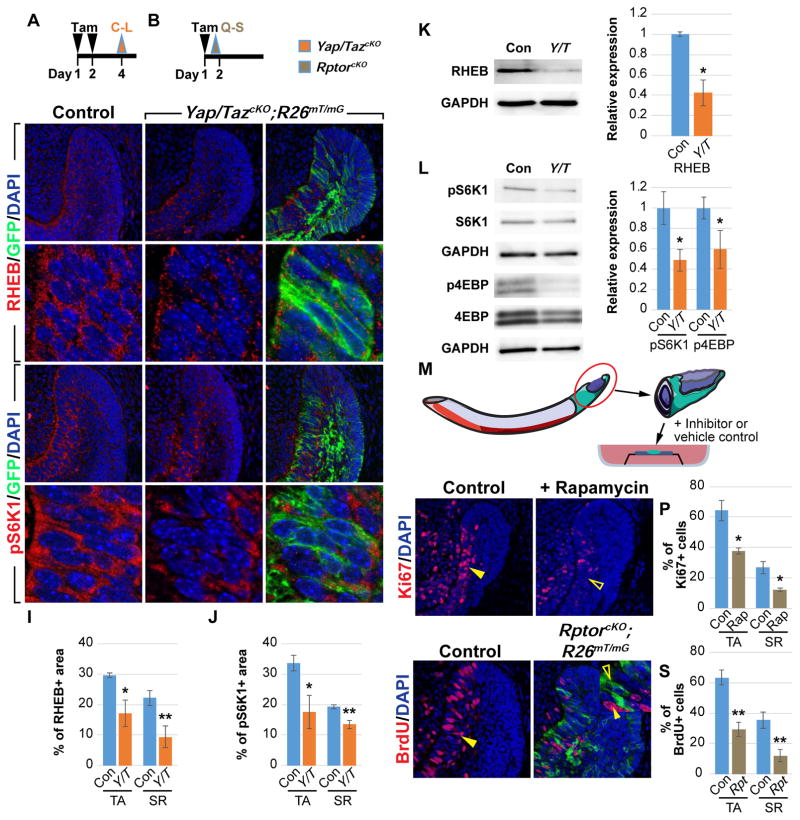
Figure 3. YAP/TAZ are required for Rheb expression and mTOR signaling.
(A and B) Timelines indicating Cre induction (tamoxifen (Tam) injection, black arrowheads) and sample collection (orange and brown arrowheads).
(C–J) RHEB (C–E’) and pS6K1 (F–H’) immunostaining in control and Yap/TazcKO laCLs. The percentage of RHEB and pS6K1 positive area is quantified (I and J).
(K and L) Immunoblotting and relative expression of RHEB (K), pS6K1, and p4EBP (L).
(M) Schematic of the explant culture system.
(N–P) Ki67 expression in control and Rapamycin-treated explants. Closed and open arrowheads respectively mark normal and reduced proliferation. The percentage of Ki67-positive (+) cells per section is quantified (P).
(Q–S) BrdU labeling in control and RptorcKO laCLs. Closed and open arrowheads mark normal and reduced proliferation in wild type and mutant cells respectively. The percentage of BrdUpositive (+) cells per section is quantified (S).
Representative images, cropped blots and quantitative data are shown. Dashed lines outline laCLs. Scale bar in R represents 50 μm in (C–E, F–H, N, O, Q, and R) and 9.76 μm in (C’–E’ and F’–H’). All quantitative data are presented as mean ± SD. *p<0.05; **p<0.01.
See also Figure S2

