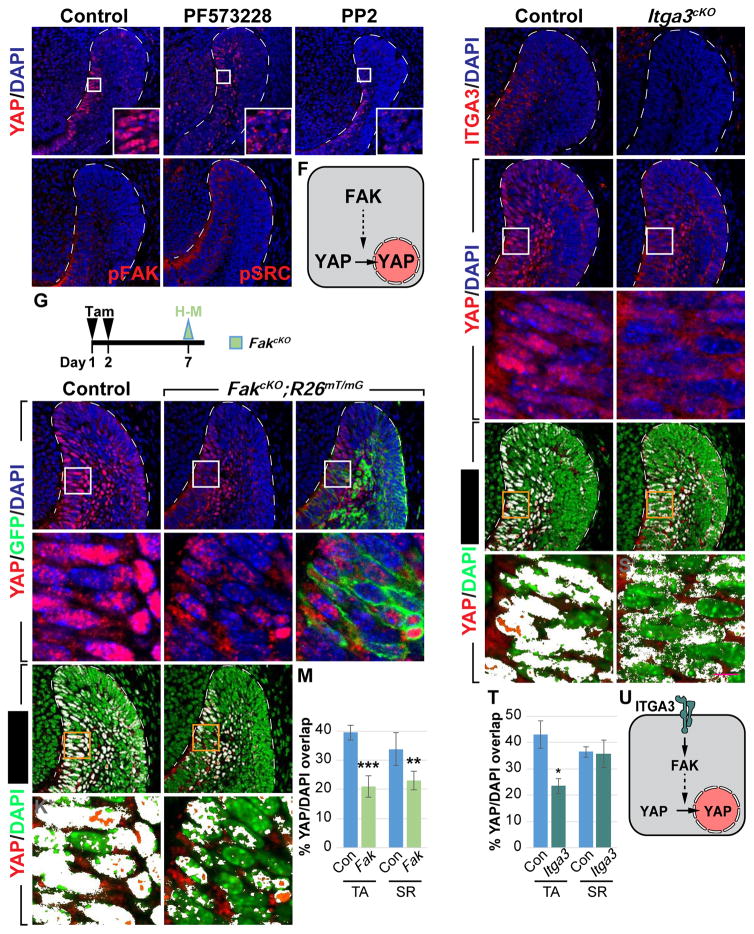
Figure 4. ITGA3/FAK signaling promotes YAP nuclear localization in TA cells.
(A–C) YAP immunostaining in control and drug-treated explants.
(D and E) pFAK and pSRC expression in laCLs.
(F) Schematic diagram of a TA cell, where FAK promotes YAP nuclear localization.
(G) Timeline depicting tamoxifen (Tam) treatment (black arrowheads) and sample collection (green arrowhead).
(H–M) YAP immunostaining in control and FakcKO laCLs. The percentage of YAP/DAPI overlap is quantified (K–M).
(N and O) ITGA3 expression in control and Itga3cKO laCLs.
(P–T) YAP immunostaining in control and Itga3cKO laCLs. The percentage of YAP/DAPI overlap is quantified (R–T).
(U) Schematic diagram showing ITGA3/FAK signaling promotes nuclear YAP accumulation in TA cells.
Representative images and quantitative data are shown. Dashed lines outline laCLs. Scale bar in S’ represents 50 μm in (A–E, H–J, K, L, N–Q, R, and S) and 9.76 μm in (H’–J’, K’, L’, P’, Q’, R’, and S’). All quantitative data are presented as mean ± SD. *p<0.05, **p<0.01; ***p<0.001.
See also Figures S3 and S4

