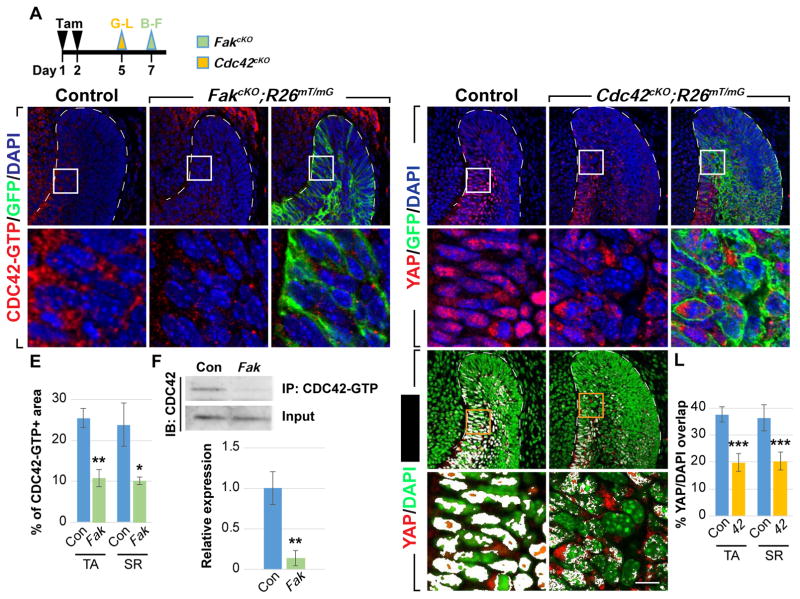
Figure 5. CDC42 acts downstream of FAK to regulate YAP nuclear localization.
(A) Timeline depicting tamoxifen (Tam) treatment (black arrowheads) and sample collection (green and yellow arrowheads).
(B–E) Immunostaining of active CDC42 in control and FakcKO laCLs. The percentage of area with positive CDC42-GTP staining is calculated (E).
(F) Immunoprecipitation of CDC42-GTP followed by CDC42 immunoblotting. Relative expression between control and FakcKO is quantified.
(G–L) YAP immunostaining in control and Cdc42cKO laCLs. The percentage of YAP/DAPI overlap is quantified (J–L).
Representative images, cropped blots and quantitative data are shown. Dashed lines outline laCLs. Scale bar in K’ represents 50 μm in (B–D, G–I, J, and K) and 9.76 μm in (B’–D’, G’–I’, J’, and K’). Data are presented as mean ± SD. *p<0.05; **p<0.01; ***p<0.001
See also Figure S4.

