
Figure 1.
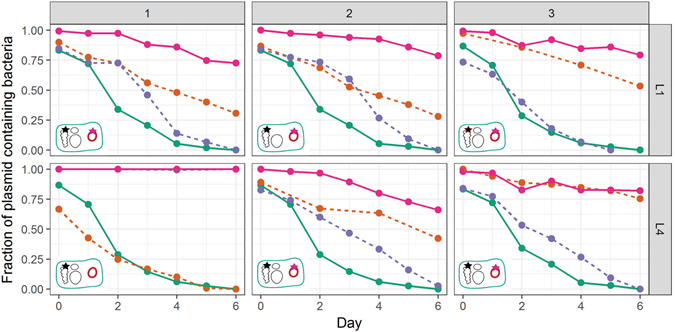
Persistence of the ancestral and evolved plasmids in the ancestral and co-evolved hosts from lineages L1 and L4 (clones L1-1, L1-2, L1-3 and L4-1, L4-2, L4-3, indicated as 1,2 and 3 above the panels). Solid lines: ancestral and evolved clones; dashed line: permuations of evolved/ancestral host/plasmids;  : ancestral plasmid in ancestral host;
  : ancestral plasmid in evolved host;
  : evolved plasmid in ancestral host,
  evolved plasmid in its co-evolved host. Each line is the mean of 3 individual replicates. For clarity error bars are not shown but the previously described plasmid population dynamics model29, 34, 35 was used to determine if the persistence dynamics of two bacteria-plasmid pairs where similar or not (see Materials and Methods and SI). Inserts in the bottom left of each graph depict with a star the location of the mutation(s) (plasmid or chromosome) responsible for the increased plasmid persistence. Each replicon wihin the evolved cells are shown: the chromosome, the native plasmids (black circles) and the plasmid pBP136Km (pink circle). Note: plasmid-free segregants of evolved hosts were obtained after replicating the evolved plasmid-containing host onto non-selective media.