
Figure 2.
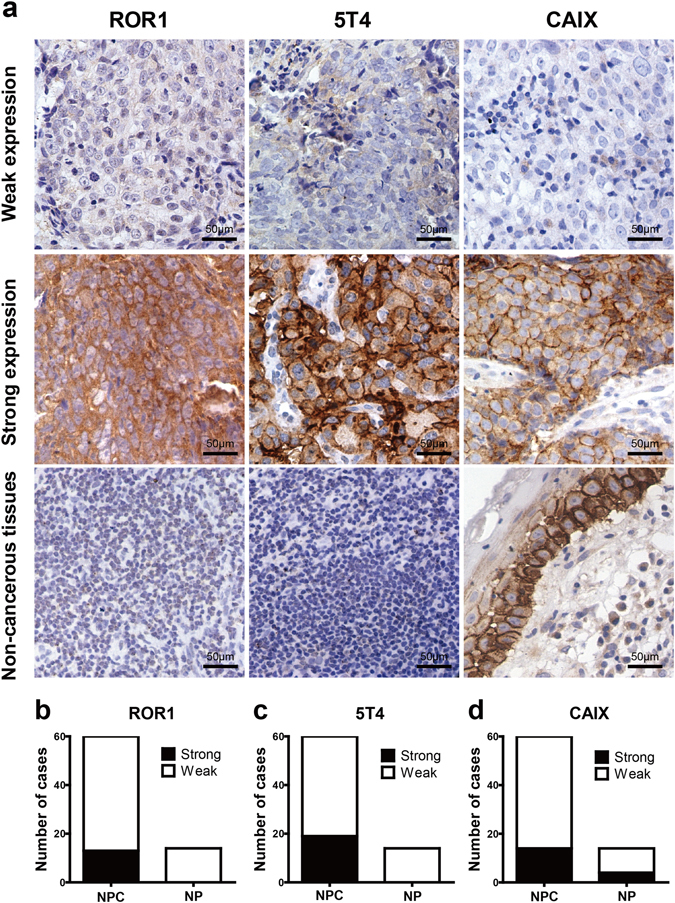
Expression of ROR1, 5T4 and CAIX in NPC tissues. (a) The expression patterns of ROR1, 5T4 and CAIX in NPC tissues were determined using IHC with the corresponding antibodies. Representative images of weak expression (score ≤ 4), strong expression (score ≥ 6) and the negative control for each gene are shown. A detailed description is provided in the Methods section. The number of NPC cases (n = 60) and non-cancerous tissues (n = 14) with strong or weak staining of ROR1 (b), 5T4 (c) and CAIX (d) are shown in each histogram.