Figure 2.

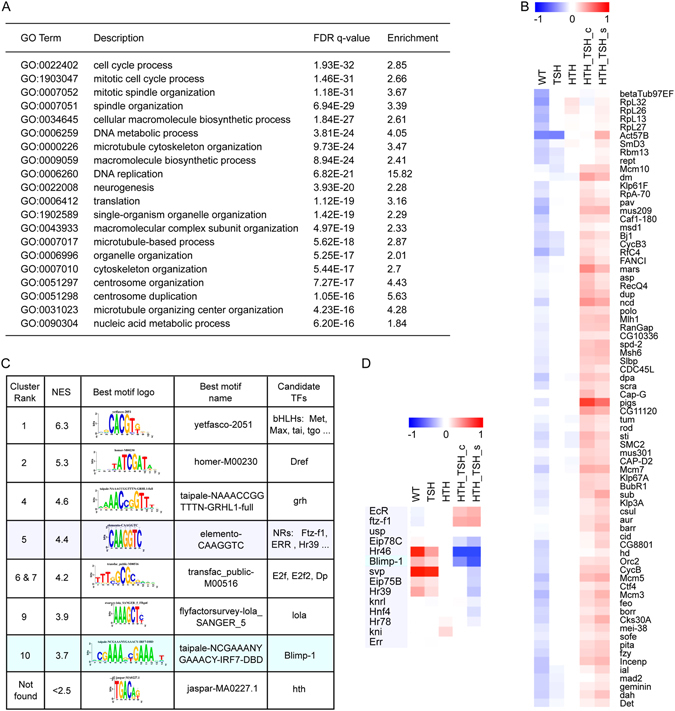
Transcriptomic profile of of hth + tsh cells. (A) Gene Ontology enrichment of genes up-regulated in hth + tsh compared to control eye discs (EA). Analysis performed by GOrilla97 on a ranked list of genes sorted by (signed) −log10(p-value). The sign indicates that up-regulated genes are on top (logFC > 0) and down-regulated genes (logFC < 0) are on the bottom of the list. (B) Heatmap with row-normalized expression values of the most significantly up-regulated cell-cycle related genes. (C) Motif enrichment on the up-regulated genes (770 genes, selected as the “leading edge” of the GOrilla analysis for cell cycle enrichment). Enrichment analysis is performed by i-cisTarget33 and enriched motifs are clustered within i-cisTarget using STAMP103. NES = Normalized Enrichment Score (>2.5 is significant). The Hth motif was not found enriched. (D) Heat map of expression profiles of motif related Nuclear Receptor genes and Blimp-1, showing strongest up-regulation of EcR and ftz-f1, and strongest down-regulation of Hr46 and Blimp-1.
