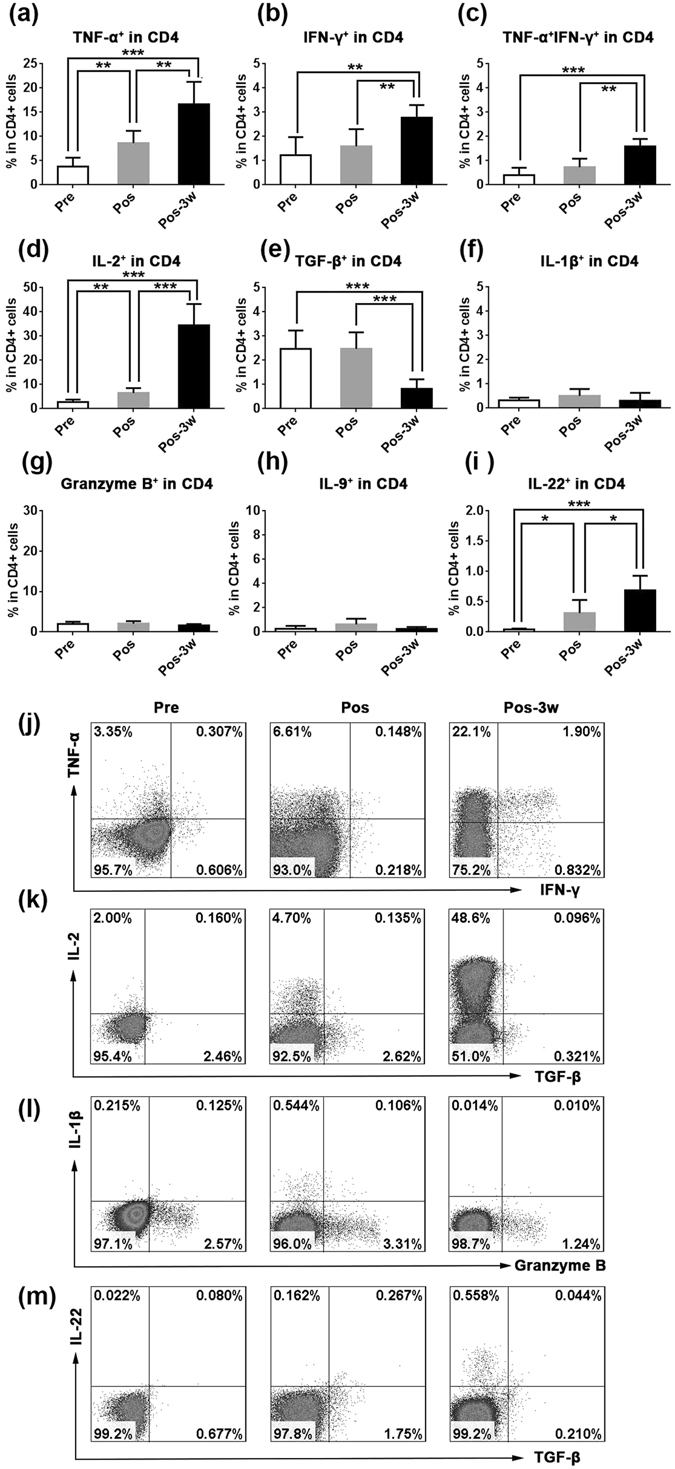
Figure 3.

Cytokine secretion by peripheral CD4+ T cells after treatment with HSRT. PBMCs were activated using a leukocyte activation cocktail for 6 h, and the cells were then collected and labeled with IFN-γ (j), TNF-α (j), IL-2 (k), TGF-β (k), IL-1β (l), granzyme B (l), or IL-22 (m). The mean values of the percentage of cells that were TNFα+CD4+ T cells in CD4+ T cells (a), IFNγ+CD4+ T cells in CD4+ T cells (b), TNFα+IFNγ+CD4+ T cells in CD4+ T cells (c), IL-2+CD4+ T cells in CD4+ T cells (d), TGF-β+CD4+ T cells in CD4+ T cells (e), IL-1β+CD4+ T cells in CD4+ T cells (f), granzyme B+ CD4+ T cells in CD4+ T cells (g), IL-9+CD4+ T cells in CD4+ T cells (h), and IL-22+CD4+ T cells in CD4+ T cells (i) were analyzed at the indicated times. The panel j–m showed the representative result from one patient. The data are shown as the mean values ± SEM (n = 6). Statistics were derived using ANOVA with Bonferroni’s post-test. *p < 0.0167, **p < 0.01; ***p < 0.001.
