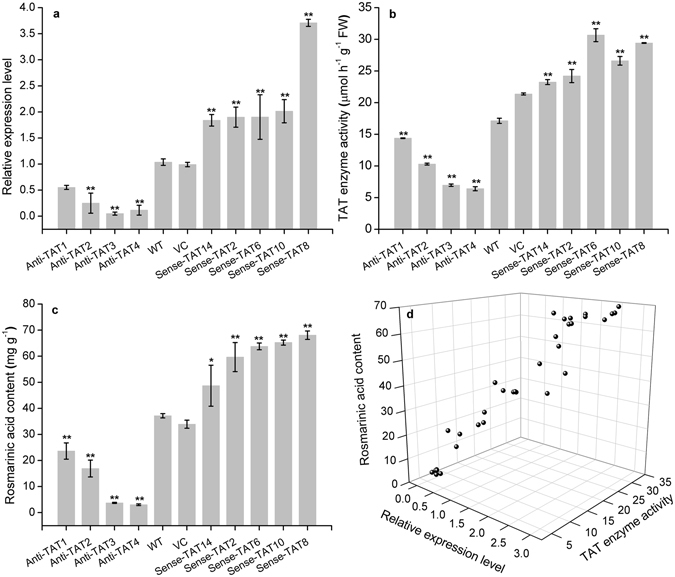
Figure 4.

PvTAT gene expression level, TAT activity, RA accumulation in wild-type and transgenetic hairy root lines, and the correlation between PvTAT gene expression level, TAT activity, and RA accumulation in hairy root lines. (a) Gene expression was determined by qRT-PCR and is shown relative to the expression level of the housekeeping gene β-actin. Transcripts of PvTAT in the wild-type hairy root lines were set to 1. (b) TAT enzyme activity was measured as describled in the Method. (c) RA accumulation was determined by HPLC. (d) Shows the correlation between PvTAT gene expression level, TAT activity, and RA accumulation in hairy root lines. Data are means ± SD of three replicates. *P < 0.05 and **P < 0.01 as determined by Tukey HSD test. WT, the untransformed hairy roots lines (wild-type control); VC, empty vector transformed hairy roots lines (vector control); Anti-TAT, antisense-expressed TAT hairy root lines; Sense-TAT, sense-expressed TAT hairy root lines.
