Figure 4.

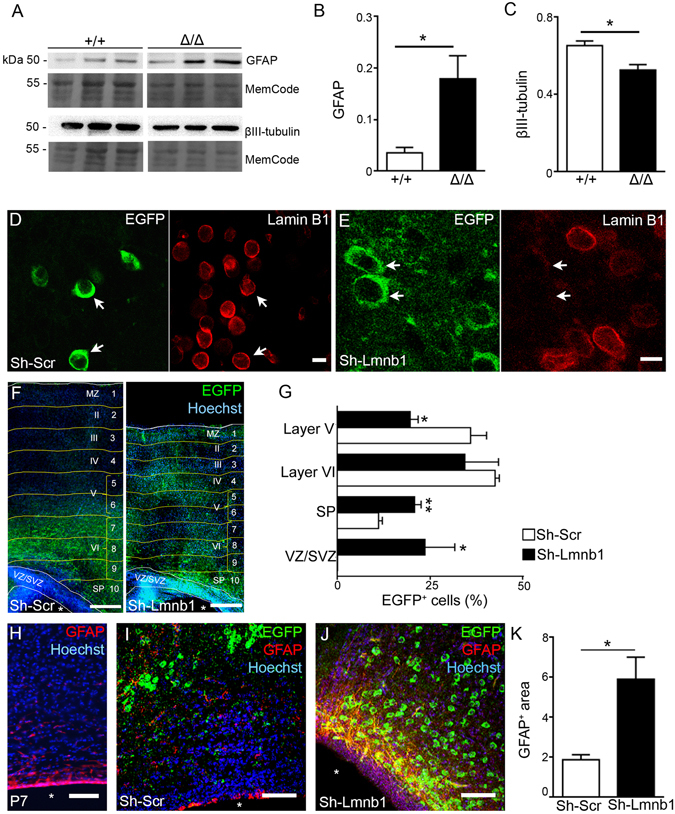
Knockdown of Lmnb1 increases GFAP protein expression in vivo. GFAP protein expression was analyzed in brain homogenates of Lmnb1 Δ/Δ and Lmnb1 +/+ embryos or in brain sections of P7 C57BL6/J pups after Lmnb1 silencing. (A) Western blot analysis of GFAP, βIII-tubulin, Lmnb1 and actin. (B,C) Quantitative analysis of GFAP (A,B) and βIII-tubulin (A,C) in E17.5 Lmnb1 Δ/Δ and Lmnb1 +/+ brain lysates. Data are normalized on MemCode. Graph bars represent the average ± SEM. n = 3/genotype, *p < 0.05; **p < 0.01, Student’s t-test. Cropped blots presented in Fig. 4A and full-length blots are presented in Supplementary Fig. S5. (D,E) Maximal projections of confocal z-stack images of immunoreactivity for Lmnb1 (red) and EGFP (green) in P7 brains after electroporation with sh-Scr (D) and sh-Lmnb1 (E) Arrows indicate corresponding electroporated cells. Scale bars: 5 µm. (F) Fluorescence confocal images of immunoreactivity for EGFP (green) in P7 brains electroporated with sh-Scr and sh-Lmnb1 plasmids. Scale bars: 50 µm. White lines delimit the VZ/SVZ and the cortical superficial boundary. Yellow lines delineate bins (Hevner et al.40), which are identified by Arabic numbers. Roman numerals indicate cortical layers I-VI. MZ, marginal zone; SP, sub-plate. Nuclei were counterstained by Hoechst 33342 dye (blue); white asterisks identify the ventricle. (G) Quantitative analysis of EGFP+ cells in P7 brains as a function of their position in the cortex after electroporation with sh-Scr and sh-Lmnb1. Graph bars represent the average percentage of EGFP+ cells/layer ± SEM from 3 independent experiments. *p < 0.05, **p < 0.01 vs respective layer in sh-Scr, Student’s t-test. (H) Fluorescence confocal images of immunoreactivity for GFAP (red) in naïve P7 C57BL6/J brain. (I,J) Maximal projections of confocal z-stack images of immunoreactivity for GFAP (red) and EGFP (green) in P7 C57BL6/J brains electroporated with sh-Scr (I) or sh-Lmnb1 (J). In (H–J), nuclei are counterstained with Hoechst 33342 (blue). White asterisks identify the ventricle. Scale bars: 100 µm. (K) Quantitative analysis of area immunoreactive for GFAP in electroporated brains. GFAP+ area is expressed as percentage of section area. Graph bars represent the average ± SEM, n = 3; *p < 0.05, Student’s t-test.
