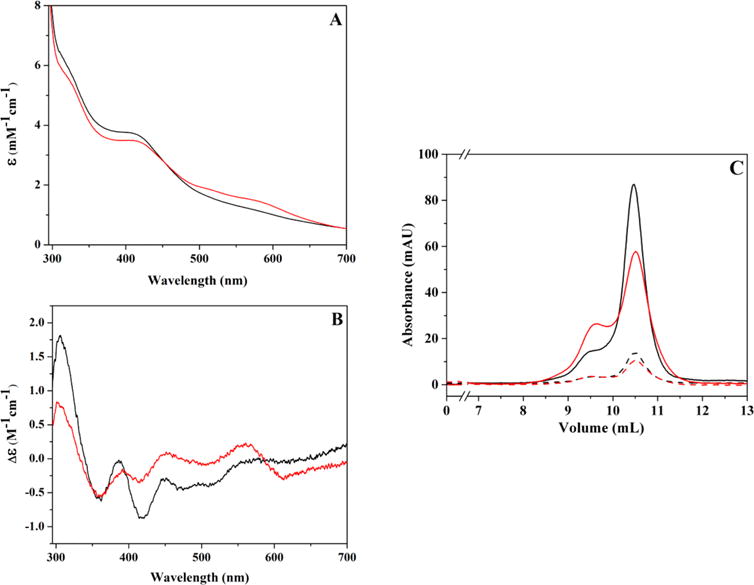
Figure 2.

Changes in spectroscopic properties and oligomeric state accompanying a freeze/thaw event for a single sample of HydF. (A) UV–visible absorbance changes for freshly purified HydF before (black; 99 μM protein at 2.18 ± 0.08 Fe/dimer) and after a single freeze-thaw event (red). ε values are reported for the total Fe concentration in sample. (B) The corresponding circular dichroism spectra for the UV–vis spectra represented in panel A; Δε values shown are for total iron content in samples. (C) Gel filtration data for the samples shown in panels A and B. Solid lines represent the absorbance reading at 280 nm, while dashed lines represent absorbance reading at 426 nm. Color scheme is consistent in all panels.
