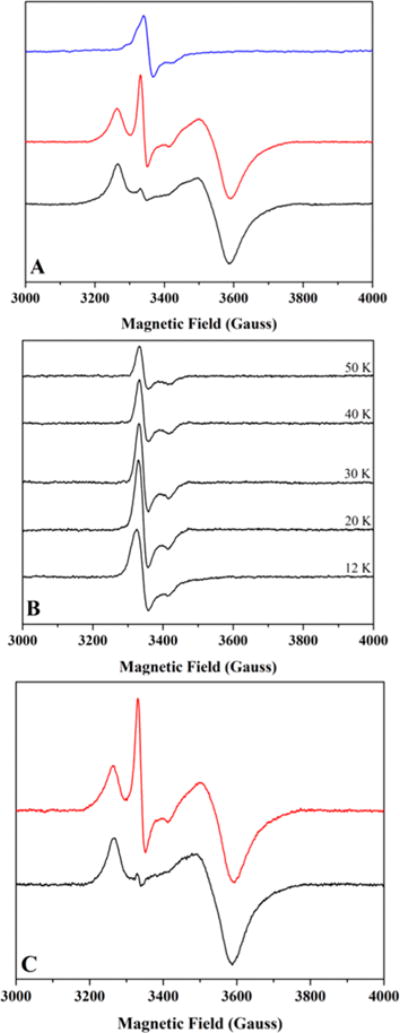
Figure 3.

Low temperature CW X-band EPR spectroscopy of HydF samples. (A) As-isolated HydF (600 μM protein at 1.14 ± 0.08 Fe/dimer); spectra collected at 14 K. Data shown are for the same sample in its as-purified state (blue) and in its photoreduced state before (black) and after (red) a thaw/freeze event. (B) Temperature relaxation profile for as-reconstituted HydF (98 μM protein at 4.8 ± 0.8 Fe/dimer). (C) As-reconstituted, photoreduced HydF (110 μM protein at 4.8 ± 0.8 Fe/dimer) before (black) and after (red) a thaw/freeze event. Spectra recorded at 10.5 K.
