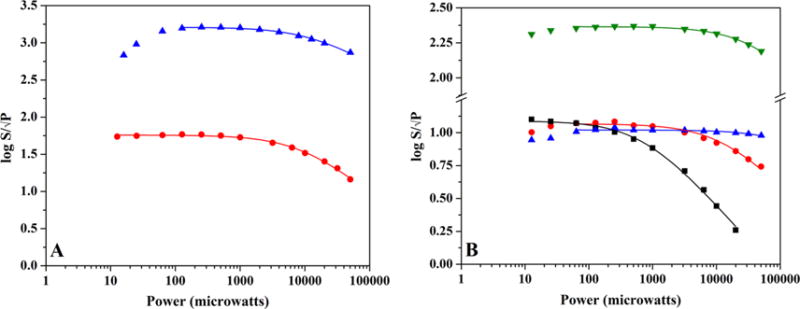
Figure 4.

EPR power saturation curves for PFL-AE and HydE. (A) Power saturation behavior of as-isolated PFL-AE (1.68 mM protein with 2.70 ± 0.10 Fe/protein) FeS cluster signals ([3Fe-4S]+ cluster signal (blue), 12 K, gain setting of 1 × 10²; [2Fe-2S]+ cluster signal (red), 30 K, gain setting of 1 × 10³). (B) Power saturation behavior of FeS cluster signals in HydE. The [3Fe-4S]+ (blue) and [2Fe-2S]+ (black) cluster signals in as-reconstituted enzyme (344 μM protein at 7.64 ± 0.10 Fe/protein) are depicted for 15 K; the [2Fe-2S]+ cluster signal at 30 K (red) is also shown for comparative purposes. Also graphed is the [4Fe-4S]+ cluster signal at 15 K (green) from DT reduced enzyme with exogenous SAM added (275 μM protein at 7.64 ± 0.10 Fe/protein).
