Figure 7.

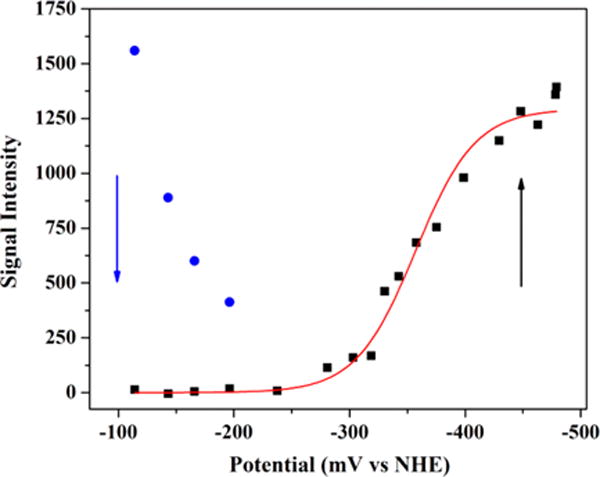
Potentiometric titration curve for freshly purified HydF. The plot shows the disappearance of the [2Fe-2S]+ cluster signal as a function of decreasing solution potential (blue), concomitant with the appearance of the [4Fe-4S]+ cluster signal (black). The [4Fe-4S]2+/+ midpoint potential was determined by fitting the increase in the signal intensity of the g = 1.89 feature as observed in 12.5 K, X-band EPR spectra to the Nernst equation for a 1 electron redox process (red line). HydF sample details are 132 μM protein at 2.28 ± 0.12 Fe/dimer.
