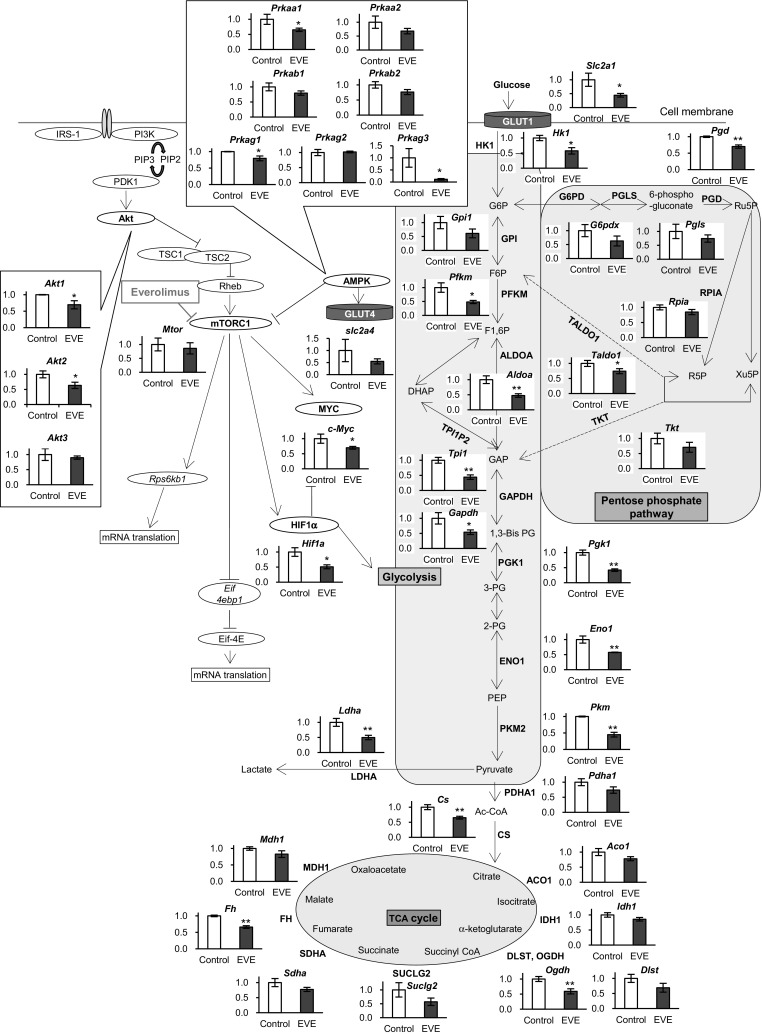
Fig. 4.

mRNA expression of enzymes and factors involved in glycometabolism. Changes in expression levels after 48 h exposure to everolimus (closed bars, EVE) were compared with those without everolimus at 48 h (Control). The data represent the mean ± S.D. (n = 3). Statistically significant difference between EVE and control: *p < 0.05; **p < 0.01 (Student’s t-test). Abbreviations are the same as Fig. 2
