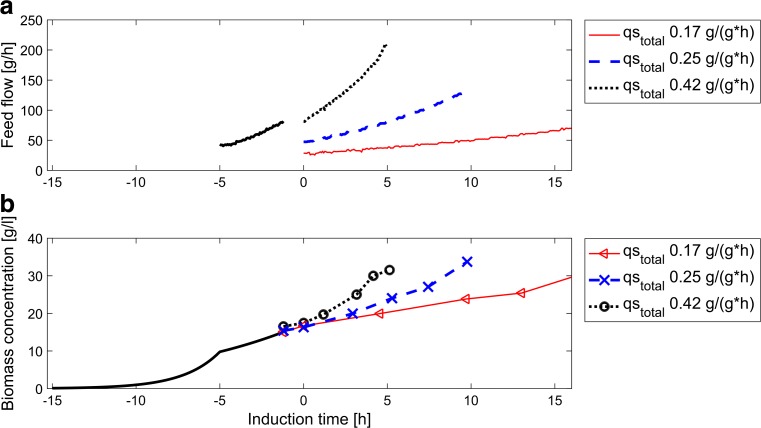
Fig. 1.
An overview a over the feed flow and b biomass concentrations during uninduced and induced fed-batch for three cultivations with different total q s. The start of induction phase is indicated as time point 0. The gap between uninduced fed-batch and induction phase represents the L-arabinose pulse. In processes with higher q s, the induction phase was shorter as a biomass concentration of 35 g/l was reached earlier. During uninduced fed-batch, feeding rates were the same for all cultivations, which is shown by the black line

