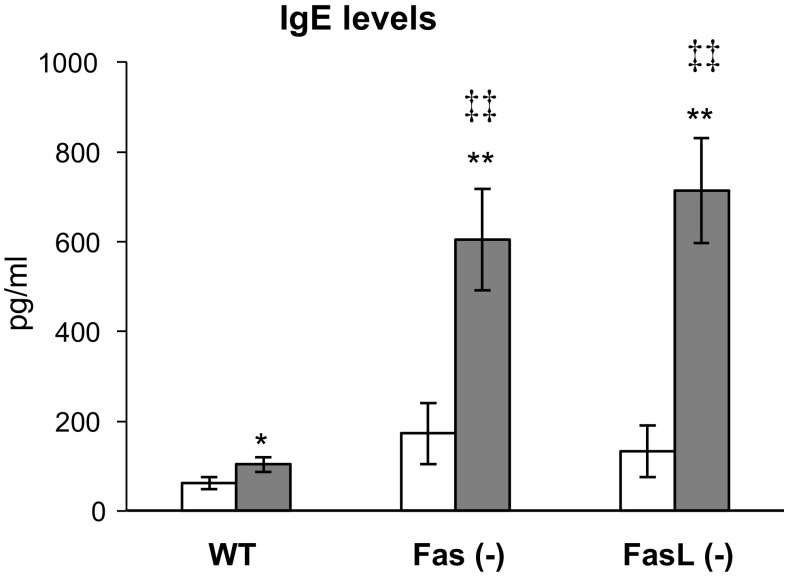
Fig. 6.
IgE antibody response in Fas (−), FasL (−) and WT (C57BL/6) mice sensitized with OVA or saline by the EC route. The bars represent the mean from 3 separate experiments ± SEM. *Significant differences with p ≤ 0.05, ** with p ≤ 0.01 in comparison to saline-treated mice, while ‡‡significant differences with p ≤ 0.001 in comparison to wild-type OVA-sensitized controls

