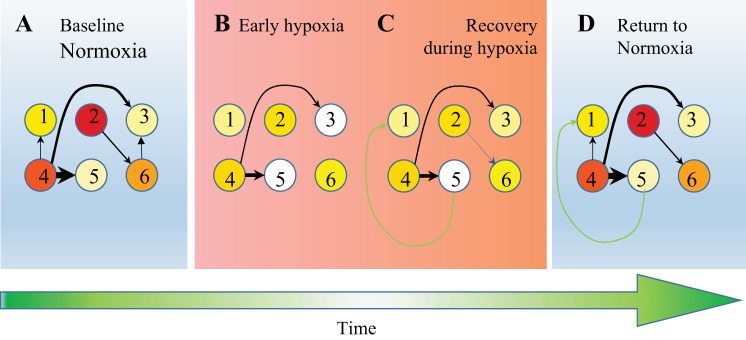
Fig. 1.
Cartoon of activity and connectivity changes during and after hypoxia. Circles represent 6 imaginary neurons; colors, from white to yellow and red, indicate an increasing spiking frequency. A: initially, neurons had a mean baseline firing frequency and baseline functional connectivity (thicker arrows represent stronger connections). B: shortly after the onset of hypoxia, firing frequencies decreased, and functional connections became weaker or disappeared. C: then, under persisting hypoxic conditions, firing rates partially recovered. Furthermore, functional connectivity showed some recovery, some connections became stronger (black arrows), some baseline connections reappeared (blue arrow), and new connections appeared (green arrow). D: upon return to normoxia, activity and connectivity showed some further recovery. Posthypoxia connectivity partly consisted of baseline connections, but also, new connections were formed during hypoxia, whereas others were lost. We investigated to what extent new connections contributed to posthypoxia connectivity and whether survival of a baseline connection was associated to its baseline strength or to baseline activity of the neurons that span the connection.

