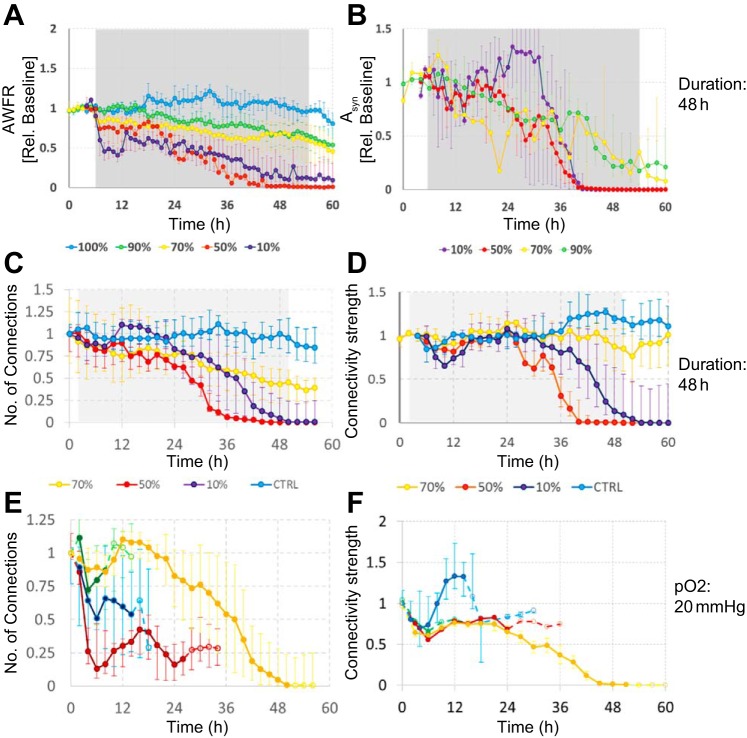
Fig. 3.
Array-wide firing rate (AWFR), stimulus responses, number of functional connections, and average normalized connectivity strength before, during, and after hypoxic period of varying depth and duration. A–D: the effect of 48 h of hypoxia at varying depths. AWFR, summed activity of all electrodes; Asyn, area under the curve of synaptically mediated phase of stimulus responses (see Fig. 2C). Gray backgrounds indicate hypoxic periods. E and F: the effect of hypoxia (10% of normoxia) at varying durations (6, 12, 24, or 48 h). Solid parts of the curves indicate the hypoxic period; dashed parts indicate normoxia. All curves show median values; error bars reflect interquartile ranges (25–75% quartiles).

