Fig. 5.
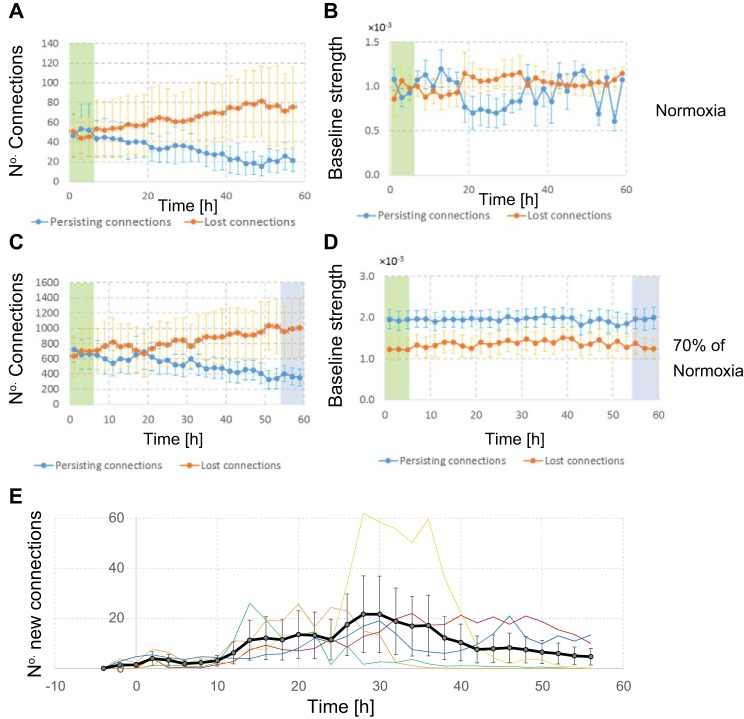
Temporal development of the number of connections. A and B: under normoxic conditions, the set of connections slowly drifts. There was no difference between the baseline strengths of persisting and lost connections. The ratio of baseline strengths of persisting and lost connections during baseline does not differ from that during later phases. C and D: at 70% of normoxia, several connections are lost at approximately hour 10 (after 4 h of hypoxia), but they reappear at approximately hour 18 (after 12 h of hypoxia). The persisting or recovered connections tended to have higher baseline strength than lost ones, but this was not significant (2-way ANOVA, P > 0.21). Note differences in the vertical scale between A and C. E: the average number of new connections. Different colors indicate different hypoxic depths; the thick black line is the average. Until ~24 h after the onset of hypoxia, the number of new connections developed at a seemingly constant rate, independent of the hypoxic conditions. Beyond 30 h, the number of new connections decreased, particularly in experiments with more severe hypoxia. Error bars represent SE.

