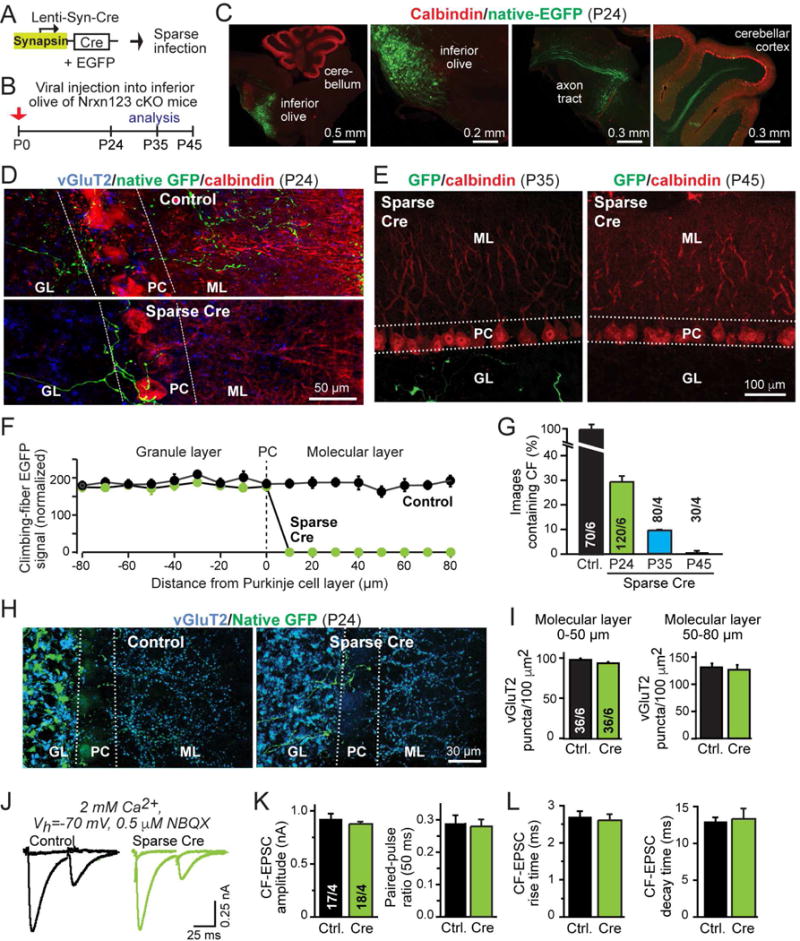
Figure 1. Sparse deletion of all neurexins in the inferior olive causes retraction of presynaptic climbing fibers from the cerebellar cortex.

(A) Schematic of lentiviruses used for sparse deletion of presynaptic neurexins from inferior olive neurons in Nrxn123 cKO mice.
(B) Timeline of experiments, with stereotactic injections of lentiviruses at P0, and analysis at P24, P35, or P45. Test mice were co-infected with viruses encoding Cre-recombinase and double-floxed EGFP; control mice were infected with virus expressing mVenus (an EGFP derivative) and inactive Cre-recombinase (ΔCre).
(C) Representative images of sagittal brain sections with sparse viral infection of the inferior olive in Nrxn123 cKO mice, stained for calbindin (red) and imaged additionally for co-expressed EGFP (green). Images show the inferior olive injection site (left two panels), and EGFP-expressing climbing fibers extending from the brain stem (middle right panel) and entering the cerebellar cortex (right panel). Injection site and axon projections were visualized in different sections from the same brain.
(D) Representative confocal images of cerebellar cortex sections after sparse infection of the inferior olive of Nrxn123 cKO mice with Cre-expressing or control viruses at P0, and analysis at P24 (green, EGFP-positive climbing fibers; red, calbindin; blue, vGluT2; GL, granule cell layer; PC, Purkinje cell layer; ML, molecular layer).
(E) Same as D, except that sections were obtained at P35 and P45, and no vGluT2 labeling was performed. Injection sites were confirmed in each animal (see Fig. S3).
(F) Plot of the climbing-fiber EGFP fluorescence intensity measured across the cerebellar cortex after in mice at P24 after sparse inferior olive infection at P0 with control viruses or viruses deleting all neurexins. Dashed line corresponds to the entire Purkinje cell layer as outlined by dashed lines in D; EGFP fluorescence was quantified as a function of the distance from these lines as indicated on the X-axis. Fluorescence intensity (arbitrary units) was averaged and normalized to background fluorescence.
(G) Summary graph of the percentage of cerebellar sections containing EGFP-positive climbing fibers in sections from control injected and Cre-injected mice at P24, and from Cre-injected mice at P35 and P45. Regions of interest (100 μm2) were randomly selected from granule cell layers in cerebellar lobule IV and V.
(H) Representative images of cerebellar cortex sections as in D, imaged for vGluT2 (blue) and EGFP to visualize total climbing-fiber synapse density.
(I) Summary graphs of the density of vGluT2+ synaptic puncta in the molecular layer proximal (0–50 μm, left) or distal to the Purkinje cell layer (50–80 μm, right) in cerebella obtained as in D.
(J–L) Normal electrophysiological properties of climbing-fiber synapses after sparse presynaptic deletion of neurexins (J, representative traces of climbing-fiber EPSCs elicited by consecutive stimuli separated by 50 ms [flat lines are below-threshold stimulations to illustrate all-or-none response nature]; K, summary graphs of the EPSC amplitude and paired-pulse ratio; L, summary graphs of the EPSC rise and decay times).
Data in summary graphs are means ± SEM; statistical comparisons were performed with Student’s t-test (*P<0.05; **P<0.01; ***P<0.001; non-significant comparisons are not labeled). Numbers in bars indicate the number of sections/mice (G & I) or cells/mice (K & L) examined. For additional data, see Fig. S1–3.
