
Figure 2. Global pan-neurexin deletions in the inferior olive impair presynaptic climbing-fiber synaptic transmission.
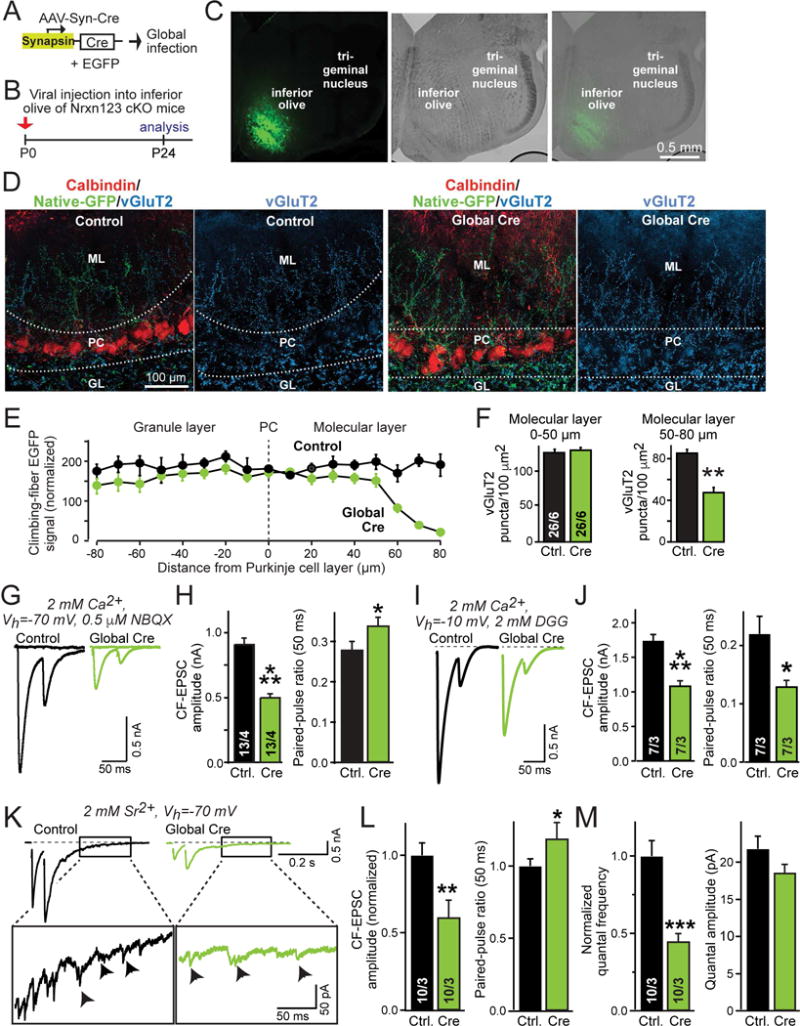
(A) Schematic of AAVs used for global deletion of presynaptic neurexins in inferior olive neurons of Nrxn123 cKO mice.
(B) Schedule of experiments, with stereotactic injections at P0, and analysis at P24, using the AAV equivalents of the test and control viruses described in Fig. 1.
(C) Representative fluorescence (left) and DIC (differential interference contrast, middle) images of the inferior olive at P24 (right) after stereotactic infection with AAVs at P0.
(D) Representative confocal images of cerebellar cortex sections obtained from mice after global infection of the inferior olive with AAVs expressing mutant or active Cre-recombinases. Left, sections were stained for calbindin (red) and vGluT2 (blue), with GFP+-climbing fibers visualized in green; right, sections were stained for vGluT2.
(E) Plot of the climbing-fiber EGFP fluorescence intensity measured across the cerebellar cortex after in mice at P24 after global inferior olive infection at P0 with control viruses or viruses deleting all neurexins. Dashed vertical line corresponds to the entire Purkinje cell layer as outlined by dashed lines in D; EGFP fluorescence was quantified as a function of the distance from these lines as indicated on the X-axis. Fluorescence intensity (arbitrary units) was averaged and normalized to background fluorescence.
(F) Summary graphs of the density of vGluT2+ synaptic puncta in the molecular layer proximal (0–50 μm, left) or distal to the Purkinje cell layer (50–80 μm, right) in cerebella obtained as in D.
(G & H) Impaired electrophysiological properties of climbing-fiber synapses after global presynaptic deletion of neurexins (G, representative traces of climbing-fiber EPSCs elicited by consecutive stimuli separated by 50 ms; H, summary graphs of EPSC amplitudes and paired-pulse ratio).
(I & J) Climbing-fiber EPSCs recorded at a holding potential of −10 mV in the presence of the low-affinity competitive AMPA-receptor antagonist γ-D-glutamylglycine (DGG; 2 mM; included in the medium; I, representative traces of climbing fiber EPSCs; J, summary plots of the EPSC amplitude and paired-pulse ratio).
(K–M) Climbing-fiber EPSCs recorded in Sr2+ (2 mM) instead of Ca2+ reveal that the size and properties of climbing-fiber quantal events are normal, even though synaptic transmission is impaired. K, representative traces; L, summary graphs of the evoked climbing-fiber EPSC amplitude and paired-pulse ratio; M, summary graphs of the frequency and amplitude of quantal events of climbing fiber synapses monitored 170–370 ms after the peak of the second EPSC. Cerebellar slices were examined at P35–P40 after P0 global viral infections.
Data in summary graphs are means ± SEM; statistical comparisons were performed with Student’s t-test (*P<0.05; **P<0.01; ***P<0.001; non-significant comparisons are not labeled). Numbers in bars indicate the number of sections/mice (F) or cells/mice (H, J, L & M) examined. Abbreviations: GL, granule layer; PC, Purkinje cell layer; ML, molecular layer. For additional data, see Fig. S4.