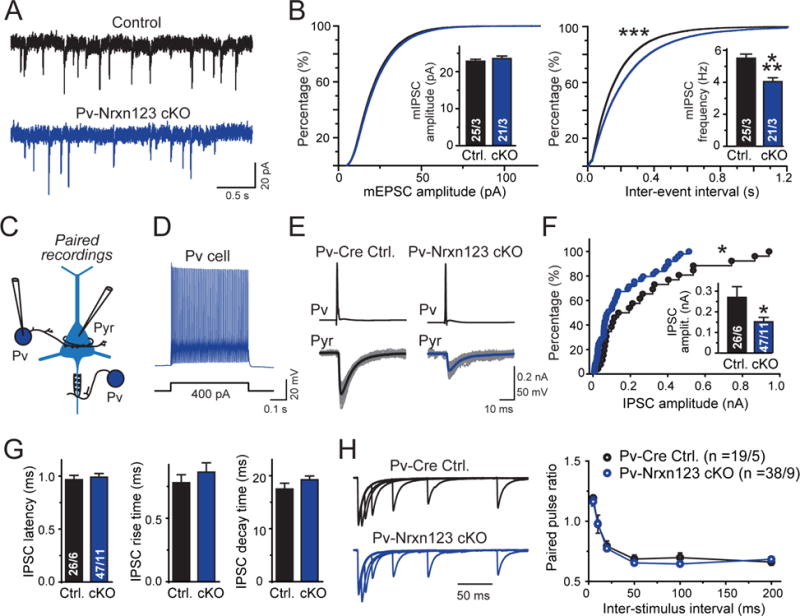
Figure 4. Paired recordings reveal that Pv-Cre mediated deletion of all neurexins in Pv+ interneurons decreases inhibitory synaptic transmission at pyramidal neuron synapses of the mPFC similar to the synapse density.

(A) Representative mIPSC traces recorded from mPFC layer 5 pyramidal neurons in acute mPFC slices from littermate control Nrxn123 cKO and Pv-Cre Nrxn123 cKO cells.
(B) Cumulative distribution plots of mIPSC amplitudes (left) and inter-event intervals (right) monitored in pyramidal neurons of Nrxn123 cKO and Pv-Cre Nrxn123 cKO mice (insets = summary graphs of average mIPSC amplitude (left) and frequency (right)).
(C) Diagram of paired recording to monitor inhibitory synapses formed by Pv+ interneurons on the perisomatic region and axon initial segments of pyramidal neurons (Pyr). For all recordings of interneuron-pyramidal neuron pairs, the necessity of visual identification of interneurons (mediated by viral injections of AAV-EF1α-DIO-eYFP) required that controls were from non-littermate Pv-Cre mice with a similar genetic background.
(D) Representative traces of a typical fast-spiking firing pattern of Pv+ interneurons.
(E) Representative traces showing unitary synaptic connections between a Pv+ interneuron and a pyramidal neuron in Pv-Cre control and Pv-Nrxn123 cKO mice (grey traces, overlaid individual responses from different trials; black/blue traces, averaged responses).
(F) Cumulative probability plot of unitary mean IPSC amplitudes (inset = summary graph of IPSC amplitudes) showing that Pv-Cre Nrxn123 cKO neurons exhibit a decrease in synaptic strength.
(G) Summary plots of the latency (left), rise time (center), and decay time (right) of unitary IPSCs in Pv-interneuron ➔ pyramidal neuron synapses.
(H) Representative traces of paired pulse ratios (PPRs) of unitary IPSCs in Pv-interneuron ➔ pyramidal neuron synapses at different interstimulus intervals (left), and summary graph of PPRs as a function of the inter-stimulus interval (right).
Data in summary graphs are means ± SEM; statistical comparisons were performed with Student’s t-test (*P<0.05; **P<0.01; ***P<0.001; non-significant comparisons are not labeled). Numbers indicate the number of connected cell pairs/mice examined. For additional data, see Fig. S6.
