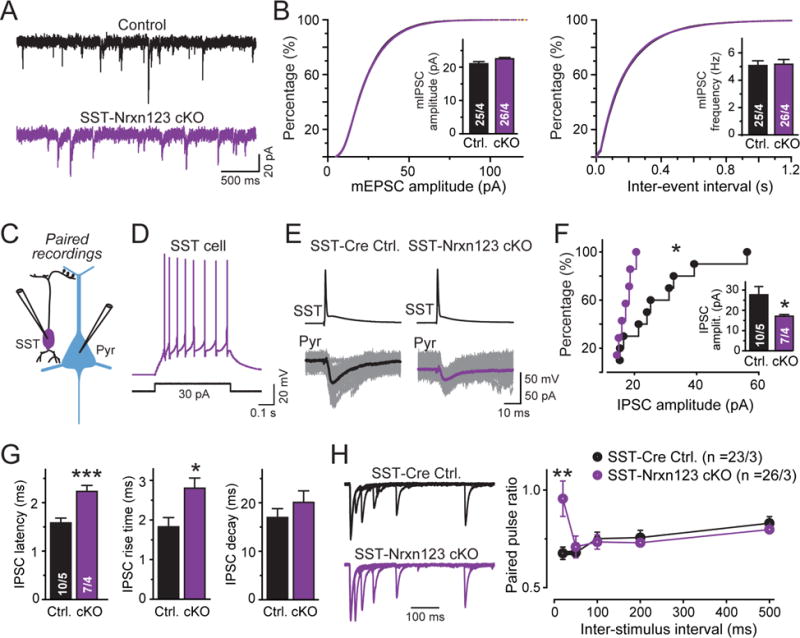
Figure 7. SST-Cre mediated pan-neurexin deletion in SST+ interneurons impairs evoked synaptic transmission as monitored by paired recordings and optogenetics.

(A) Representative mIPSC traces from littermate Nrxn123 cKO control and SST-Cre Nrxn123 cKO pyramidal neurons.
(B) Cumulative probability plots of the mIPSC amplitudes (left) and inter-event intervals (right); insets show summary graphs of the mean mIPSC amplitude (left) and frequency (right).
(C) Paired recording configuration to monitor inhibitory synapses formed by SST+ interneurons on the distal dendrites of a pyramidal neuron (Pyr). For all recordings of interneuron-pyramidal neuron pairs, the necessity of visual identification of interneurons (mediated by viral injections of AAV-EF1α-DIO-eYFP) required that controls are from non-littermate SST-Cre mice with a similar genetic background.
(D) Representative traces of a typical low-threshold-spike firing pattern of SST+ interneurons.
(E) Representative paired-recording traces showing unitary synaptic connections between an SST+ interneuron and a pyramidal neuron in SST-Cre control or SST-Nrxn123 cKO mice. SST+ cells were identified in slices by eYFP fluorescence after infection with AAVs containing double-floxed eYFP expression cassettes. IPSCs were evoked by current injections into patched presynaptic SST+ interneurons (top), and recorded from patched postsynaptic pyramidal neurons (bottom grey traces, overlaid individual responses; black/purple traces, averaged responses).
(F) Cumulative probability plot of unitary mean IPSC amplitudes (inset = summary graph of IPSC amplitudes) showing that in the overall cell population, the synaptic strength is preferentially decreased in neurons with high IPSC amplitudes.
(G) Summary plots of latency (left), rise time (center), and decay time (right) of unitary IPSCs in SST-interneuron ➔ pyramidal neuron synapses.
(H) Representative traces of paired pulse ratios (PPRs) of unitary IPSCs in SST-interneuron ➔ pyramidal neuron synapses at increasing interstimulus intervals (left), and summary graph of the mean PPRs as a function of the inter-stimulus interval (right). Unitary IPSCs were evoked by optogenetic stimulation of SST+ cells after stereotactic infection of the mice with AAVs encoding CAG-DIO-ChR2-tdTomato.
Data in summary graphs are means ± SEM; statistical comparisons were performed with Student’s t-test (*P<0.05; **P<0.01; ***P<0.001; non-significant comparisons are not labeled). Numbers indicate the number of cells and mice examined. For additional data, see Fig. S7.
