
Figure 8. Two-photon microscopy reveals that SST-Cre mediated pan-neurexin deletion in somatostatin-positive (SST+) interneurons dramatically decreased action potential-evoked presynaptic Ca2+-transients in SST+ interneurons.
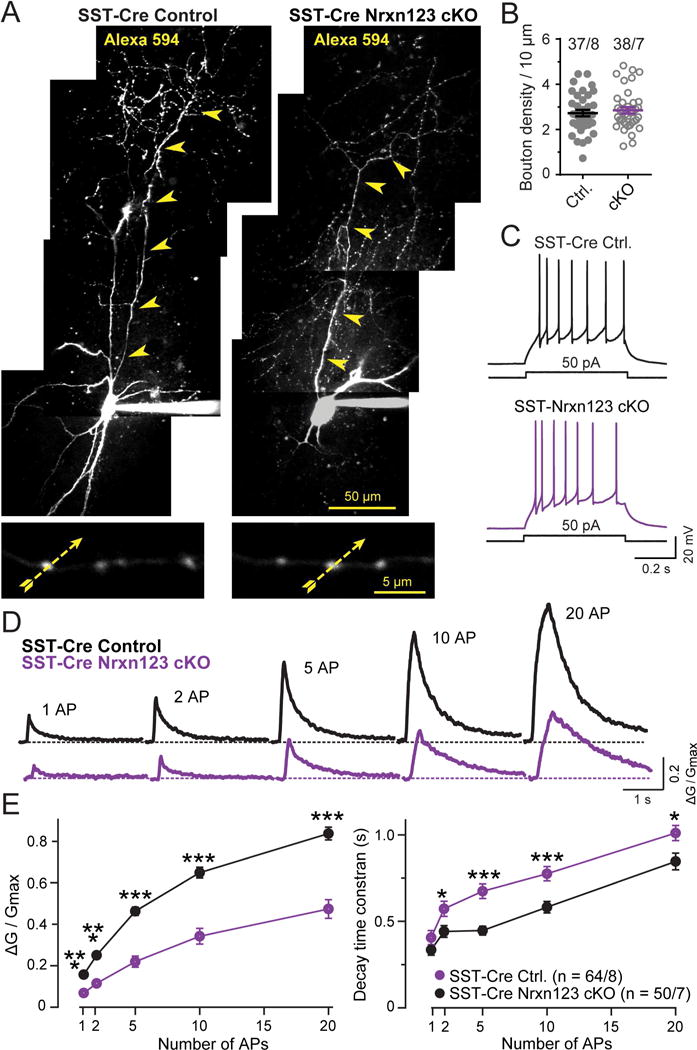
(A) Morphology of SST+ interneurons visualized by Alexa Fluor 594 fluorescence in control SST-Cre and in SST-Cre Nrxn123 cKO mice. Neurons identified via virally administered double-floxed eYFP were filled via the patch pipette with Alexa Fluor 594 (50 mM; to visualize the axonal arbor) and Fluo-5F (200 μM; to monitor presynaptic Ca2+-transients). The top image depicts a representative z-stack projection of the entire neuron (arrowheads = axon). The bottom image displays an expanded view of axonal boutons (yellow dashed arrows = line scans during action potential stimulation). Note that axons of SST+ interneurons extend into superficial mPFC layers (~ 500 μm away from the soma).
(B) Normal density of axonal boutons of neurexin-deficient SST+ interneurons (circles, individual cells; lines, means ± SEM).
(C) Representative traces depicting the low-threshold spiking firing pattern of SST+ interneurons in SST-Cre control and SST-Cre Nrxn123 cKO interneurons.
(D) Representative traces of Ca2+-transients monitored via Fluo-5F fluorescence in presynaptic boutons by line scans as indicated in A. Trains of APs (1, 2, 5,10, 20 APs at 50 Hz) were elicited by injecting current pulses (2 nA, 1 ms) through recording pipettes.
(E) Summary plots of the peak amplitudes (ΔG/Gmax, left) and decay times (measured from 100% to 37% of peak amplitude, right) of Ca2+-transients as a function of action potential numbers monitored in presynaptic boutons from SST+ control and neurexin-deficient interneurons.
Data in B and E are means ± SEM (numbers indicate number of axon branches/neurons analyzed [B] or boutons/neurons analyzed [E]); statistical comparisons were performed with Student’s t-test (*P<0.05; **P<0.01; ***P<0.001); non-significant comparisons are not labeled.