
Figure 20.
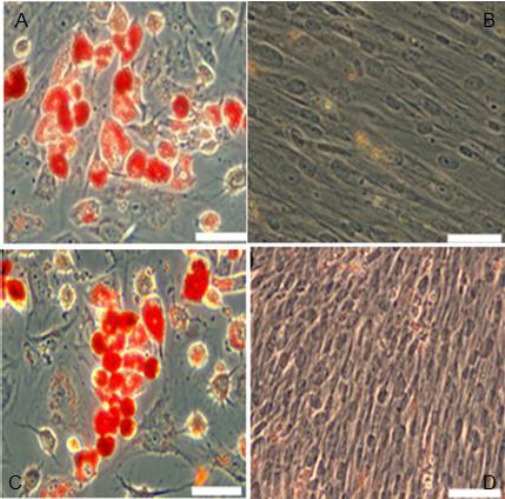
AC: hHGF-HFMSCs group and GFP-HFMSCs guoup change in cellular morphology was observed and oil red O staining revealed the presence of orange fat droplets inside cells after 2 weeks of induction; BD: Cells cultured for 2 weeks in basic medium instead of adipogenic differentiation media were used as the negative control. Oil red O staining revealed that cells did not change color (100×)