
Figure 6.
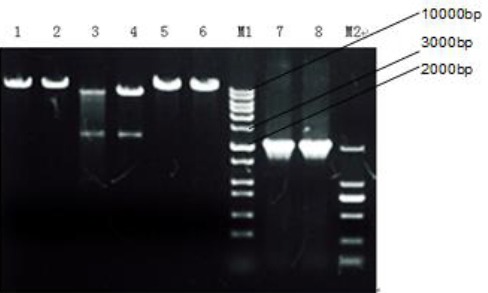
Gel electrophoresis pattern for identification of plasmid after binding with T4 ligase. 1 and 2 show bands after single digestion with XbaI while, 3 and 4 show bands after double digestion with XbaI and BamHI, 5 and 6 show bands after single digestion with BamHI, and 7 and 8 show PCR products. M1 and M2 represent marker 10000 and marker 2000, respectively