
Figures 8.
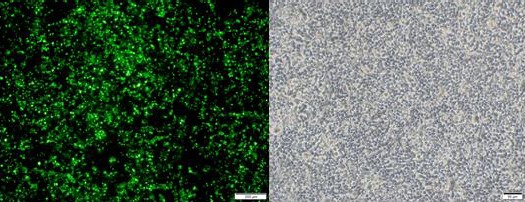
A and B are the images of 293T cells transfected with hHGF seen under a fluorescence microscope (A) and regular microscope (B) (40×)
Official websites use .gov
A
.gov website belongs to an official
government organization in the United States.
Secure .gov websites use HTTPS
A lock (
) or https:// means you've safely
connected to the .gov website. Share sensitive
information only on official, secure websites.
A and B are the images of 293T cells transfected with hHGF seen under a fluorescence microscope (A) and regular microscope (B) (40×)