Fig. 2.

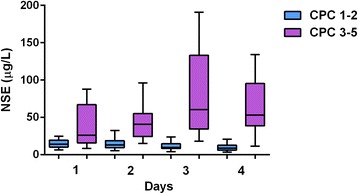
Neuron-specific enolase (NSE) levels measured on individual days. The NSE levels were significantly lower in the CPC 1–2 group in comparison with the CPC 3–5 group at each time point (P < 0.05). CPC Cerebral Performance Category

Neuron-specific enolase (NSE) levels measured on individual days. The NSE levels were significantly lower in the CPC 1–2 group in comparison with the CPC 3–5 group at each time point (P < 0.05). CPC Cerebral Performance Category