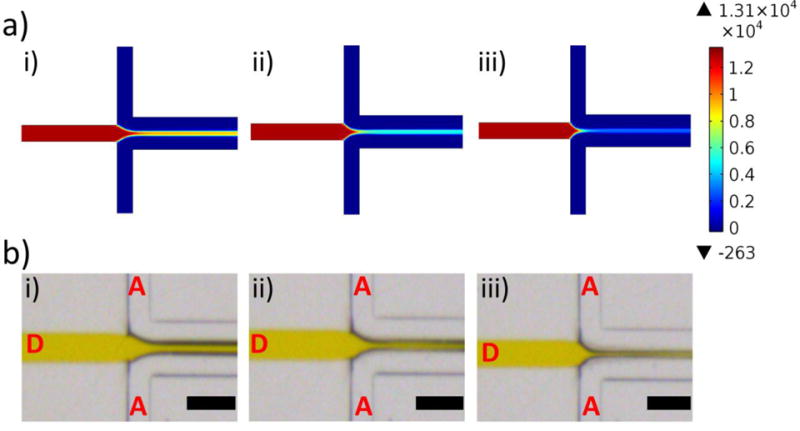
Figure 6.

Computational and experimental determination of flow conditions on-chip. (a) CFD-generated concentration profiles depicting DMF and water concentrations on-chip. The colour legend indicates DMF concentration (mol/m3), red corresponds to a high DMF concentration, and blue corresponds to a low DMF concentration. CFD simulations were run for FRR-5 (i), FRR-10 (ii), and FRR-20 (iii). (b) Brightfield microscope images of the chip in operation. A yellow food colorant was used to distinguish the DMF stream (labelled “D”) from the aqueous stream (labelled “A”). The flow rate ratio (FRR) varies from 5 (i) to 10 (ii) and 20 (iii). The black scale bar corresponds to 200 μm.
