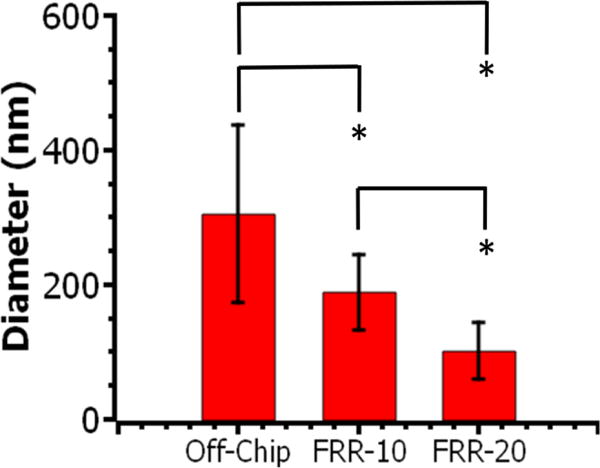
Figure 8.

Diameter of oligovaline-PHEA-C18 (DSC18 = 20%) micelles quantified with TEM images. At least 15 particles were analysed per condition. * represents the statistical significance of the difference between conditions (*p < 0.05). Values and bars correspond to averages and standard deviation of one set of size measurements, respectively.
