
Fig. 2.—
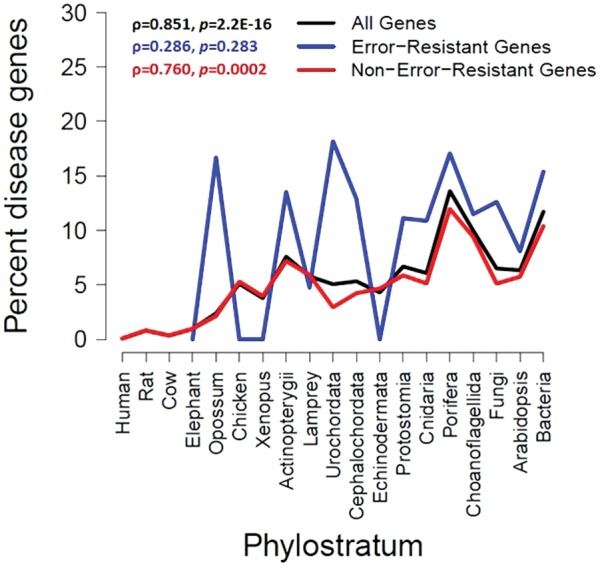
Percentage of disease genes in each age group. Rank correlation (ρ) between age group and percentage disease genes is shown for all genes, error-resistant genes based on simulation, and non-error-resistant genes, respectively.
Official websites use .gov
A
.gov website belongs to an official
government organization in the United States.
Secure .gov websites use HTTPS
A lock (
) or https:// means you've safely
connected to the .gov website. Share sensitive
information only on official, secure websites.
Percentage of disease genes in each age group. Rank correlation (ρ) between age group and percentage disease genes is shown for all genes, error-resistant genes based on simulation, and non-error-resistant genes, respectively.