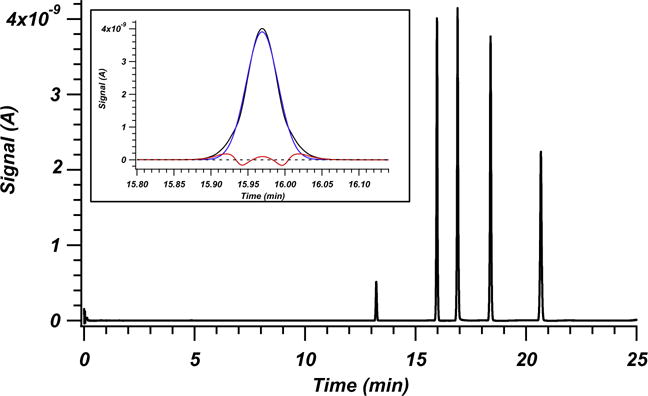
Fig. 1.

Example chromatogram for one of the three columns packed with sonication and run at 1630 bar. This column is represented by red triangles in Figs. 2 and 3. Peaks from left to right are L-ascorbic acid, hydroquinone, resorcinol, catechol and 4-methyl catechol. The inset presents an enlargement of the hydroquinone peak used for the reduced plate height curves in Fig. 2. The experimental data is plotted in black, the Gaussian fit in blue and the residuals are plotted in red. A black dashed line is overlaid at 0 signal for reference. (For interpretation of the references to colour in this figure legend, the reader is referred to the web version of this article.)
