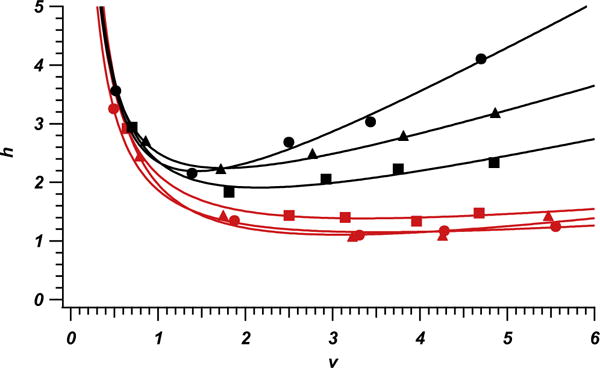
Fig. 2.

Plot of reduced van Deemter fits for hydroquinone on each of the 6, 1-m long columns. Columns packed with sonication are presented in red while columns prepared without sonication are plotted in black. Marker shapes (circles, squares and triangles) distinguish each column within the parameters represented by color. (For interpretation of the references to colour in this figure legend, the reader is referred to the web version of this article.)
