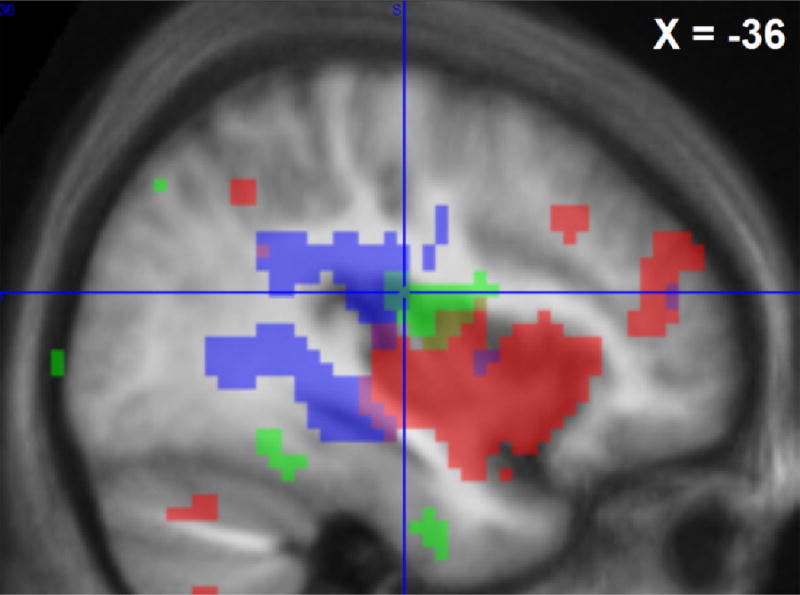
Fig. 6.
Cerebral areas that were activated by the Laser-test stimulation during lukewarm, i.e. control, conditioning (shaded area with black dots) or sustained cold conditioning (shaded area with light-grey dots) and areas where cold-induced inhibition of laser responses covariated with individual analgesia ratings (“physiological analgesia”, outlined in white), p < 0.001 uncorrected maps are shown on a sagittal section of average of individual normalized structural T1 images (n = 24) at X = −36 mm MNI. Crosshair location is at the maximum of green contrast ([−36 −16 19]*PM).

