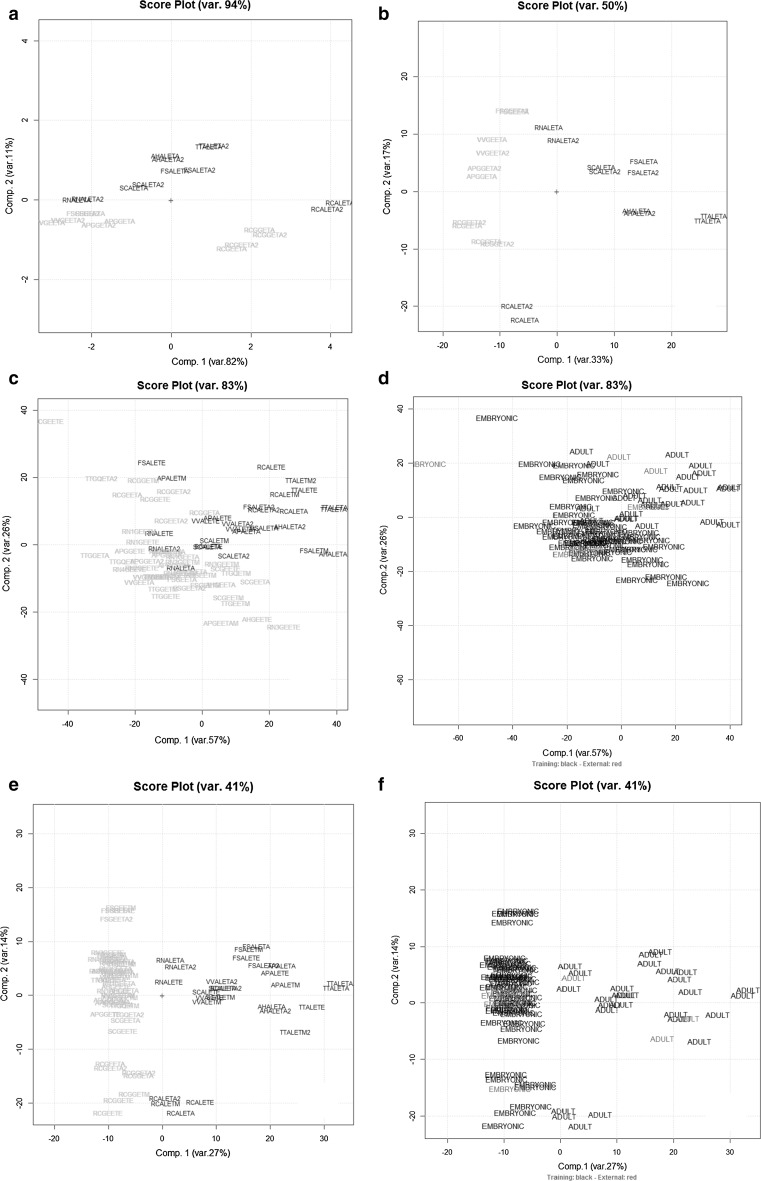
Fig. 2.
The PC1–PC2 scores plot of the UV–VIS absorbances data matrix R22,571 (a) and after 1st order derivatization (b) (embryonic stage: green samples; adult stage: blue samples). The PC1–PC2 scores plot of the UV–VIS absorbances data matrix A80,571 (c) and after 1st order derivatization D80,571 (e) (embryonic stage: green samples; adult stage: blue samples) calculated using the 73 training set samples and the corresponding plot obtained projecting the external test set (7 samples highlighted in red and coded according Table 1) respectively (d, f) (color figure online)

