Fig. 3.

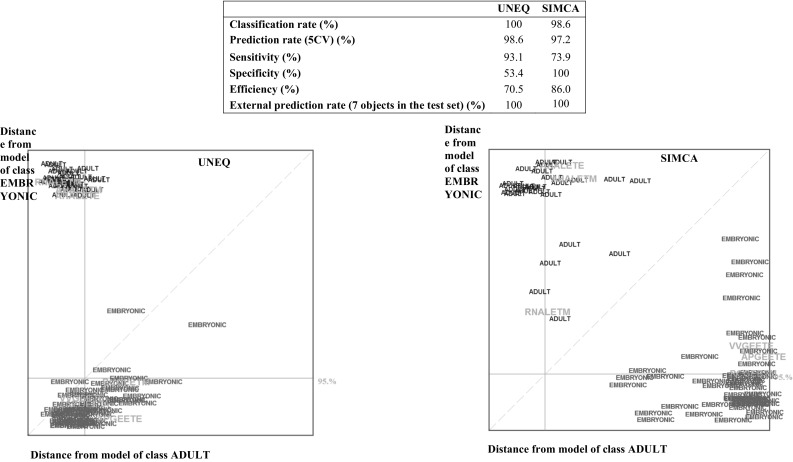
UNEQ and SIMCA results of the 1st order derivatives data matrix D80,57 with the corresponding Coomans plot for the embryonic class (green) and the adult class (blue). The external test set objects are shown in red (color figure online)

UNEQ and SIMCA results of the 1st order derivatives data matrix D80,57 with the corresponding Coomans plot for the embryonic class (green) and the adult class (blue). The external test set objects are shown in red (color figure online)