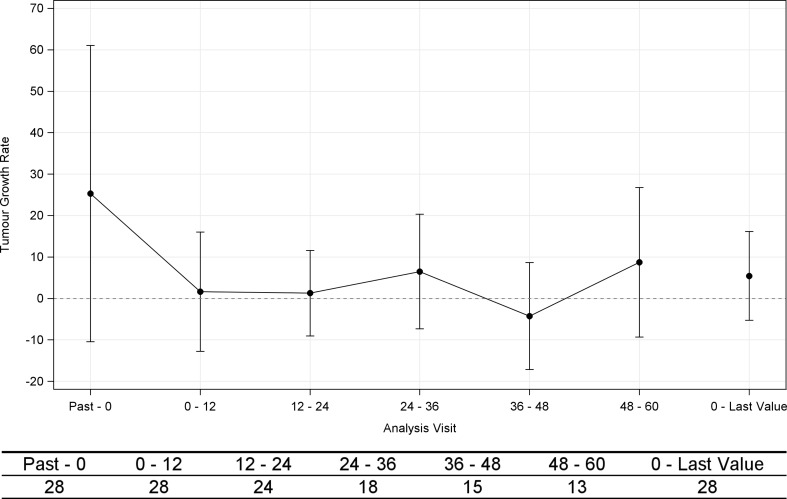
Fig. 4.
Percent changes from baseline in mean (± standard deviation) tumor growth rates (TGR; full analysis set, n = 28). Note: Data from Past to 0 (baseline) were evaluated by the investigator based on RECIST (ver. 1.1). Data after the baseline were evaluated based on RECIST (ver. 1.1) via central assessment by an independent third party

