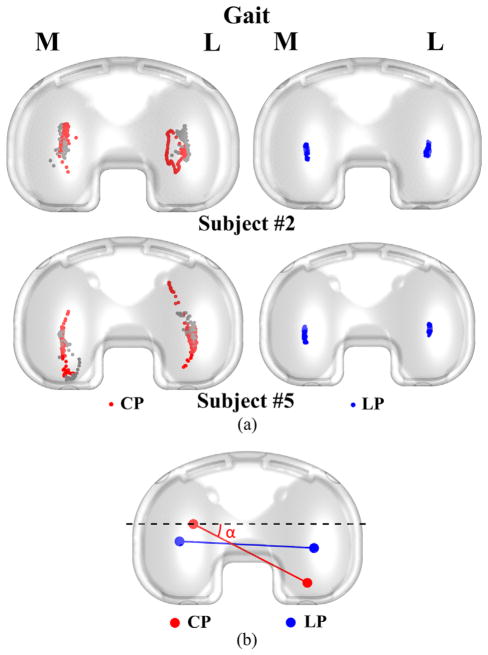
Figure 6.
(a) Sample comparison of LP and CP estimates for gait of two subjects. The gray dots represent the CP location during swing phase. Both subjects #2 and #5 have right knee implants. (b) Line connecting the CPs (red) compared to the line connecting the lowest points of the femoral component (blue) at a given flexion angle. The CP angle (α) between the CP line (red) and the ML axis of the tibial component (dashed black) is also shown.

