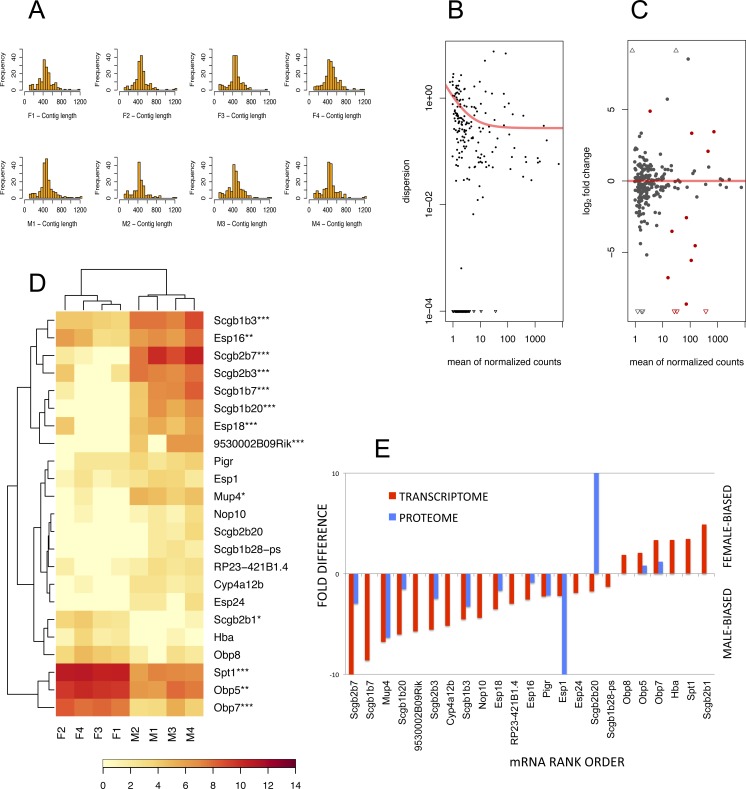
Figure 3. The RNA-seq analysis output.
Histograms of mRNA contig lengths from size-selected transcriptomes (A) are consistent over individuals and show that more than 50% of contigs is longer than 400 bps and not exceeding 1,300 bps. Dispersion plot (B) shows the decreasing variation in signal intensities, and along with MA plot (C) are demonstrating that the transcripts with lower number of reads have a higher dispersion. Significant sexually dimorphic abundances based on p < 0.05 are demonstrated with the hierarchically clustered heat map in (D), with p-adjusted values provided with asterisks (* P ≤ 0.05, ** P ≤ 0.01, *** P ≤ 0.001). (E) is demonstrating a partial support for a concordance in fold differences between mRNA expression (p < 0.05) and particular protein abundances for example for OBP5, OBP7, MUP4, ESPs and several secretoglobins. This relationship, however, is not linear (i.e. note huge differences in ESP1 or SCGB2B20 abundances) thus suggesting multiple sources of expression.

