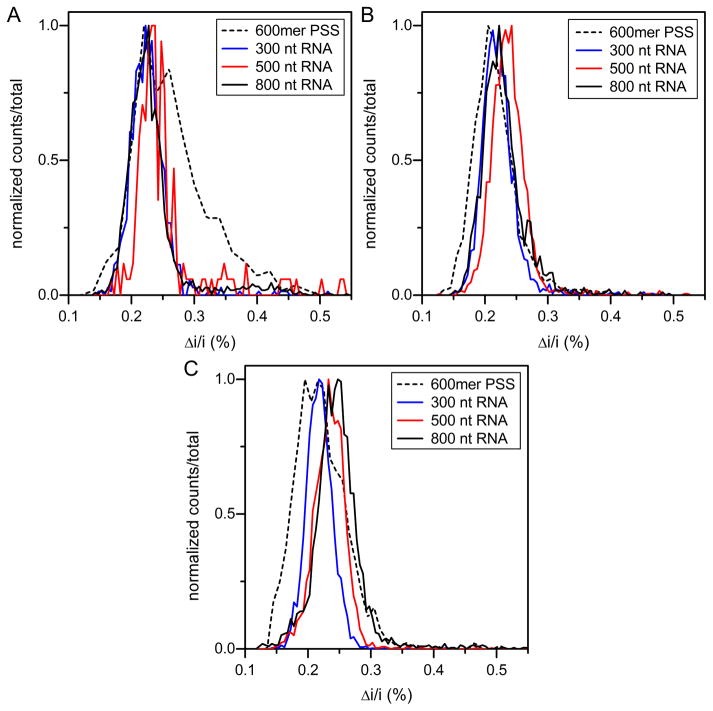
Figure 4. Histograms of average pulse amplitude for assembly products from SEC fractions (A) 17, (B) 19, and (C) 21.
(A) Histograms for fraction 17 (total counts = 3749). The assembly becomes more heterogeneous as the size of the substrate increases. (B) Histograms for fraction 19 (total counts = 7479). The assembly is much more homogeneous, but the larger substrates still show some slight preference toward larger products. (C) Histograms for fraction 21 (total counts = 9606). The assembly is largely homogeneous, but the larger substrates shift slightly to larger species. The average pulse amplitude (Δi) is normalized by the baseline current (i).

