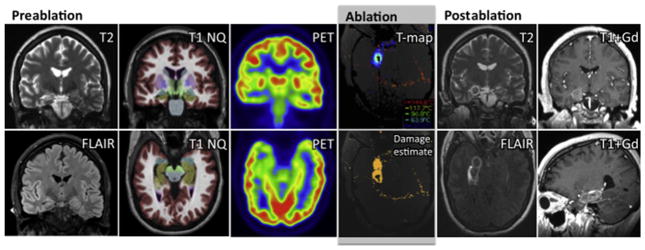
Fig. 4.
Imaging associated with a case of SLAH for right MTS. Preablation diagnostic MRI (coronal T2 and fluid-attenuated inversion recovery [FLAIR], first column) show typical features of right hippocampal atrophy and mildly increased T2 and FLAIR intensity. Coronal and axial T1 with NeuroQuant (CorTechs Laboratory, San Diego, CA) analysis (second column) with colorized mesial temporal structures (amygdala in blue, hippocampus in brown) further exhibit right MTS. Coronal and axial FDG-PET images (third column) emphasize reduced hypome-tabolism of right mesial temporal structures. Visualase workstation screenshots during SLAH procedure (fourth column) show real-time axial MR gradient-based T-map during LITT in amygdala region (above) and combined irreversible damage estimate encompassing mesial temporal structures at time of procedure completion (below). Immediate postablation MR images show features after LITT including T2 (coronal) and FLAIR (axial) hypointense rings (fifth column), and peripheral contrast enhancement surrounding T1 hypointensity (coronal/sagittal gadolinium [Gd]-contrasted T1 images, sixth column).

